- Facts and Figures
- Social Security Statistics
- Social Media Statistics
- Cell Phone Usage Statistics
- Cryptocurrency Statistics
- White Collar Crime Statistics
- Crowdfunding Statistics
- Branding Statistics
- How Many Emails Are Sent Per Day
- Money Laundering Statistics
- Childcare Availability Statistics
- Cold Calling Statistics
- Automation And Job Loss Statistics
- Student Loan Statistics
- Spam Statistics
- Password Statistics
- Ransomware Statistics
- Christmas Spending Statistics
- Average Grocery Cost By State
- Average Screen Time Statistics
- Average Monthly Expenses
- IoT Statistics
- Gen Z Statistics
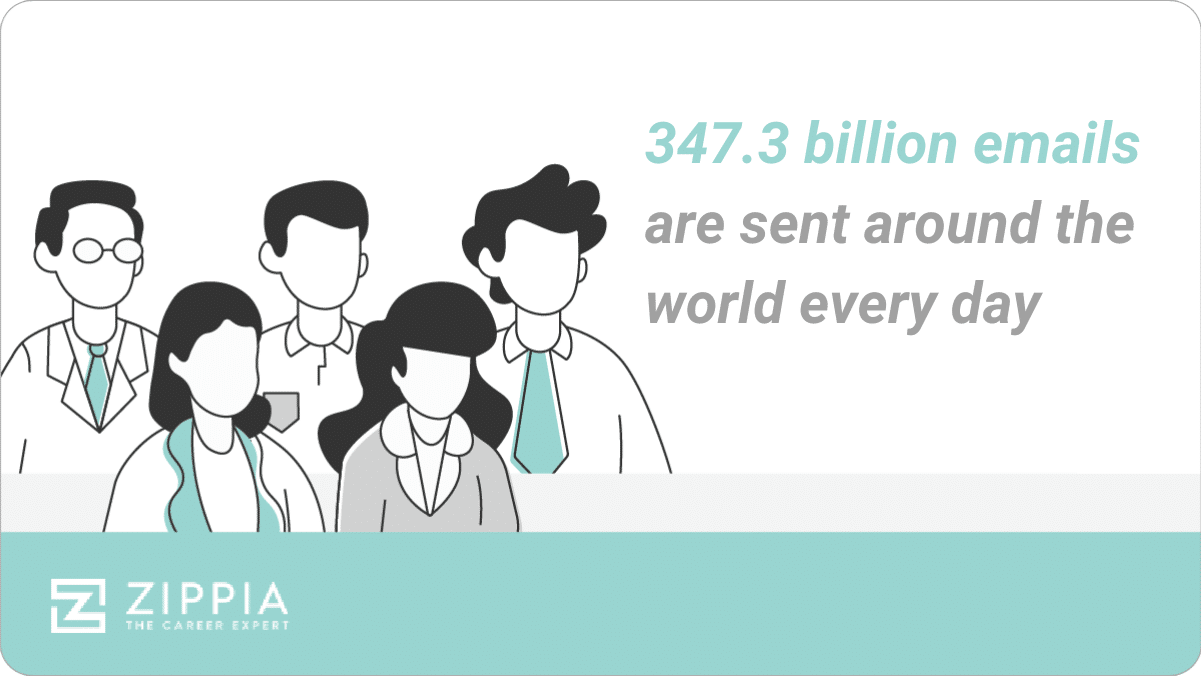
Research Summary: In 2026, approximately 347.3 billion emails are sent and received daily worldwide, with mobile devices accounting for 61.9% of email opens. As email remains a pivotal tool for communication and marketing, understanding its dynamics is crucial for businesses aiming to engage their audience effectively.
Our analysis highlights the following key statistics:
-
347.3 billion emails are sent every day globally in 2026.
-
61.9% of all emails are accessed on mobile devices, reflecting a significant shift in user behavior.
-
The average email open rate stands at 18%, varying slightly based on the day of the week.
-
Email continues to be a favored method among B2B and B2C marketers for nurturing leads and driving revenue.
-
The typical email comprises 434.48 words.
-
Email marketing boasts an impressive average return on investment (ROI) of 4,200%.
-
4 out of 5 marketers would prioritize email over social media for their marketing strategies.
For deeper insights, we categorize the data into several sections:
Mobile | Open, Click, and Bounce Rates | Multimedia | B2B and B2C | Formatting | Marketing
General Email Statistics
Billions of emails are exchanged daily around the globe, and this number is projected to increase. Notably, email usage varies significantly across age demographics.
-
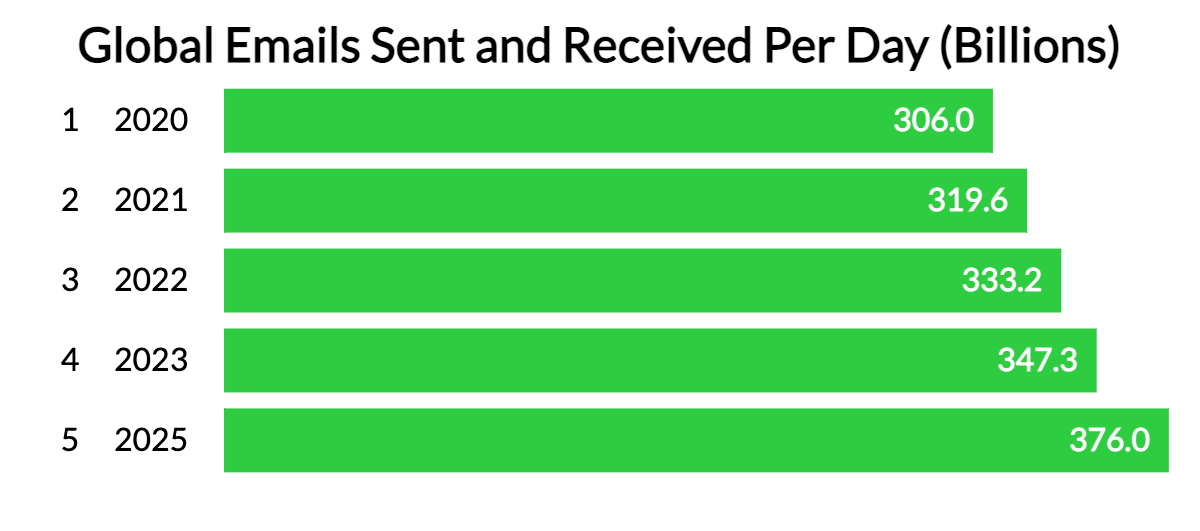
In 2026, businesses and consumers collectively send and receive about 347.3 billion emails each day, with projections estimating this will exceed 376 billion by 2025.
-
In 2023, over half of the global population (approximately 4.3 billion) utilized email, expected to rise to 4.6 billion by 2025.
-
The Apple iPhone leads the email client market with a 29% share of opens, followed closely by Gmail at 27%, followed by Apple Mail, Outlook, and Yahoo Mail.
-
Email usage is prevalent among 89.4% of men and 91.1% of women.
-
Millennials, born between 1981 and 1996, typically spend around 6.4 hours daily on email, in contrast to older generations who average five hours.
-
45% of internet users are hesitant to open emails from unfamiliar addresses.
| Share of U.S. Email Users by Ethnicity | |
|---|---|
| Ethnicity | Percentage |
| White, non-Hispanic | 91.7% |
| African American | 88.3% |
| Hispanic | 85.4% |
| Asian American | 92.1% |
| American Indian or Alaska Native | 83.5% |
| Other, non-Hispanic | 91.8% |
Mobile Email Statistics
For years, a substantial portion of internet users has opted to open emails on mobile devices, and this trend continues to foster higher engagement.
-
Mobile devices account for nearly half of all web traffic globally, a trend that has persisted since early 2017.
-
Mobile devices comprised 61.9% of all email opens in 2023.
-
40% of individuals aged 18 and under consistently open emails on their mobile devices first.
-
Approximately 25% of those who open an email on mobile will do so again; 70% of them will reopen on mobile, while 30% will switch to desktop. Mobile readers who do so are 65% more likely to engage further.
-
66% of emails opened on mobile devices are read for over eight seconds.
-
Creating mobile-friendly emails is the second most common tactic employed by email marketers to enhance performance.
-
Nearly 20% of email campaigns are not optimized for mobile devices.
Email Open, Click, and Bounce Rate Statistics
Email open, click, and bounce rates fluctuate greatly based on timing, industry, email type (e.g., welcome versus promotional), subject lines, and multimedia content.
-
Globally, the average email open rate is 18%.
-
In the U.S., 21% of email opens occur between 9 AM and noon.
-
Email campaigns dispatched at 4 AM see an open rate of 24.31%, followed by 9 AM at 20.22% and 11 AM at 20%.
-
The average email deliverability across email service providers is 79.6%.
-
Across all sectors, email maintains an average open rate of 17.61%, with a click rate of 8.74% and a bounce rate of 10.64%.
-
The non-profit sector enjoys the highest email open rates (30.85%), followed by the restaurant and food sector (30.09%), real estate (28.37%), healthcare (26.88%), and arts and entertainment (25.97%).
-
The transportation services industry has the highest bounce rate at 15.93%, followed by legal services (14.42%), real estate (13.17%), and personal care services (13.16%).
-
Welcome emails boast an impressive average open rate of 82%.
-
Timeliness affects open rates significantly; for instance, 21.49% of emails are opened within the first hour, which drastically drops to 8.91% after one hour and 5.81% after two hours.
-
Personalized subject lines can yield 50% higher open rates.
-
Incorporating videos in emails can amplify click rates by 300%.
| Average Email Benchmarks by Day | |||||||
|---|---|---|---|---|---|---|---|
| Sunday | Monday | Tuesday | Wednesday | Thursday | Friday | Saturday | |
| Open Rate | 18% | 18.3% | 18% | 18.1% | 17.9% | 18.9% | 17.3% |
| Click-Through Rate | 2.5% | 2.5% | 2.5% | 2.6% | 2.5% | 2.7% | 2.4% |
| Click-to-Open Rate | 13.9% | 13.7% | 13.5% | 14.5% | 14.1% | 14.5% | 14% |
| Unsubscribe Rate | 0.1% | 0.1% | 0.1% | 0.1% | 0.1% | 0.1% | 0.1% |

Email Multimedia Statistics
Most recipients favor emails that include images or videos, which significantly enhances both open and click rates.
-
65% of recipients prefer emails that are predominantly visual, while 35% favor text-heavy emails.
-
54% of email subscribers show a preference for emails that contain videos.
-
Emails that mention “video” can boost open rates by 19%, click-through rates by 65%, and reduce unsubscribes by 26%.
-
Emails with attached videos can see click-through rates soar to 96%, marking a 200-300% increase compared to plain-text emails.
-
Emails with images achieve over a 6% higher open rate (21.44% vs. 15.02%) compared to those without visuals.

Business (B2B and B2C) Email Statistics
Email is a crucial communication channel for both B2B and B2C marketers, facilitating revenue generation and content distribution.
-
Nearly 75% of customers prefer using email for business communications.
-
87% of B2B marketers utilize email as a distribution channel, with 59% identifying it as their most effective revenue-generating tool.
-
79% of B2C marketers depend on email to share their new articles or blog posts.
-
90% of marketers employ email marketing to disseminate content organically.
-
31% of businesses deploy email newsletters for lead nurturing.
-
Companies that A/B test every email report returns that are 37% higher than those that do not.
-
Emails with a single call to action can see click rates increase by 371% and sales by 1617%.
-
Emails featuring active discount codes have an eightfold higher chance of generating sales compared to those without discounts.
Email Formatting Statistics
Effective email communication relies not only on the content but also on the structure of your message, including subject lines, body length, and multimedia inclusion.
-
The average email consists of 434.48 words and typically takes around 3.3 minutes to read.
-
Subject lines average 43.85 characters in length.
-
6.9% of subject lines incorporate emojis.
-
76% of professionals have used emojis in digital communication.
-
Subject lines containing emojis can boost open rates by 56% compared to those without.
-
Subject lines with emojis slightly outperform those without (20.37% vs. 19.73%).
-
69% of email recipients may report an email as spam based solely on the subject line.
-
Email signatures that include photos receive 32% more responses than those without.
-
An ideal email signature should not exceed seven lines in length:
-
75% contain contact information;
-
60% include a phone number;
-
7% list Twitter details;
-
3% include Facebook;
-
2% provide LinkedIn details.
-
-
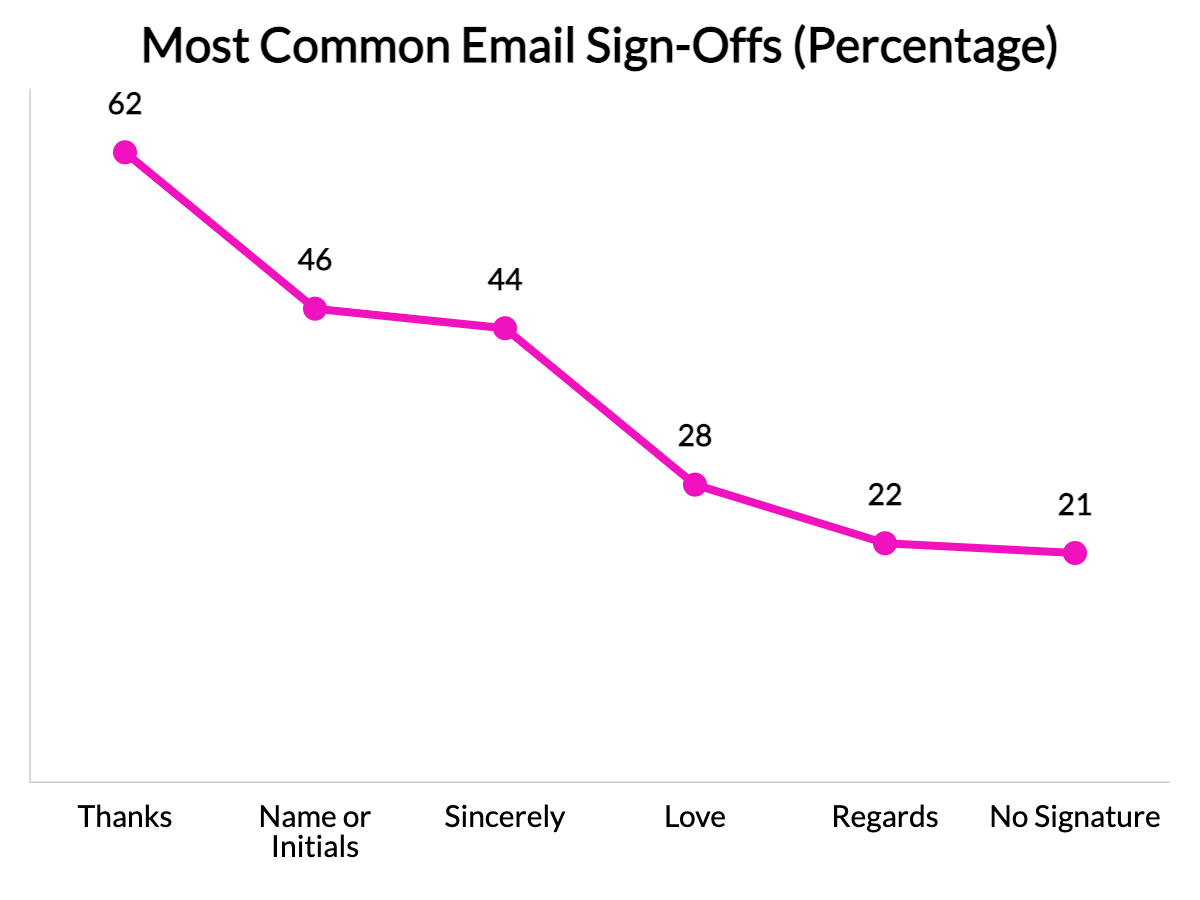
Common email sign-offs include “Thanks” (62%), initials or a name (46%), “Sincerely” (44%), “Love” (28%), “Regards” (22%), and no sign-off (21%). **Respondents could select multiple answers.
-
17% of users perceive emails as formal, 33% as informal, and 49% as situational.
-
8% of email campaigns fail to include an unsubscribe link.
-
Subject lines containing “video,” “fw,” “!,” or “now” achieve better open rates than those without.
Email Marketing Statistics
Email remains one of the most effective marketing channels, offering the highest ROI while also serving as a valuable tool for measuring content engagement.
-
Email marketing yields the highest return on investment for small businesses.
-
For every $1 spent, email marketing generates a return of $42.
-
29% of marketers deem email marketing the most effective channel (compared to 25% for social media, 22% for SEO, and 25% for content marketing).
-
64.1% of small businesses engage in email marketing, with 59% of B2B companies opting out.
-
78% of marketers view email as critical to their business success, an increase from 71% in 2019.
-
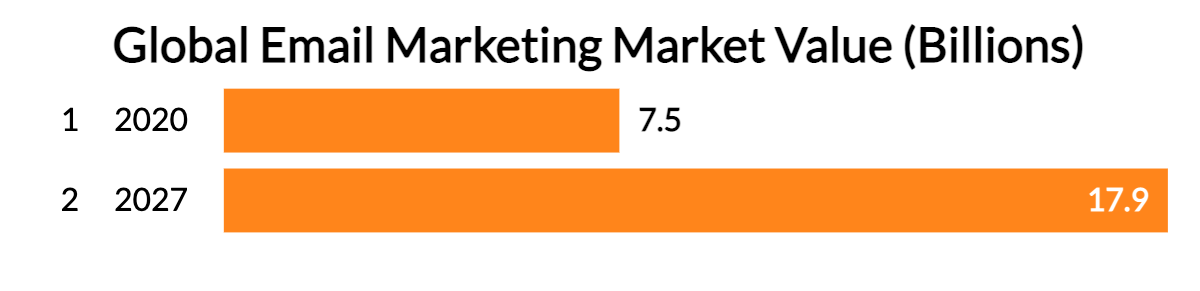
The global email marketing market was valued at $7.5 billion in 2020, projected to rise to $17.9 billion by 2027.
-
B2B companies typically send an email marketing campaign every 25 days.
-
31% of B2B marketers consider email newsletters the best method for nurturing leads.
-
Weekly email newsletters result in an average open rate of 30.09%, with 47.5% of marketers adhering to this frequency.
-
35% of marketers send three to five emails weekly to their audience.
-
87% of B2B marketers identify email as one of their top free organic distribution channels.
-
90% of B2B marketers monitor email engagement (e.g., opens, clicks, downloads) to evaluate content performance.
Email FAQ
-
How many global emails are sent per day?
Approximately 347.3 billion emails are sent globally each day. This marks a 4.2% increase from 2022 when 333.2 billion were sent daily.
Additionally, projections indicate that the number of emails sent per day will likely continue to rise, potentially reaching 376 billion by 2025 (a 12.8% increase).
-
Should you include emojis in your emails?
Incorporating emojis in your emails depends on your target audience. While 76% of professionals use emojis in their professional emails, the perception of formality varies.
A business catering to a younger demographic through platforms like YouTube and TikTok may benefit from emojis, while a firm targeting an older audience with political merchandise might find emojis detrimental.
-
Millennials lead in email usage, averaging 6.4 hours daily. Older generations spend about five hours daily, whereas Gen Z tends to favor social media over email.
-
What are the average email open, click, and bounce rates?
The average email open rate is 17.61%, with a click rate of 8.74% and a bounce rate of 10.64%. These metrics can vary significantly due to factors such as timing and industry.
For example, emails dispatched at 4 AM achieve an open rate of 24.31% (38% more likely to be opened), while the non-profit sector enjoys the highest open rate at 30.85% (75% more likely to be opened).
-
What’s the average return on investment for email marketing?
The average return on investment for email marketing is 42:1. This means that for every $1 invested in email marketing, it generates a return of $42.
Conclusion
Despite the growing influence of social media, email remains an indispensable marketing tool for businesses. In fact, 4 out of 5 marketers prefer email over social platforms.
With an impressive average ROI of 4,200%, and an ongoing daily volume of 347 billion emails, email’s relevance is set to increase further, with expectations of reaching 376 billion by 2025.
In conclusion, email is far from obsolete; it continues to be a vital marketing asset for any organization.
Sources
-
The Radicati Group. Email Statistics Report, 2019-2023. Accessed on 10/1/21.
-
Statista. Email marketing revenue worldwide from 2020 to 2027. Accessed on 10/1/21.
-
Statista. Number of email users worldwide from 2017 to 2025. Accessed on 10/1/21.
-
Campaign Monitor. Small Business Marketing in 2021: Trends to refine your marketing efforts. Accessed on 10/4/21.
-
Constant Contact. Average industry rates for email as of August 2021. Accessed on 10/4/21.
-
Hubspot. Email Marketing Strategy in 2020. Accessed on 10/4/21.
-
Content Marketing Institute. B2B Content Marketing 2020. Accessed on 10/4/21.
-
Campaign Monitor. Ultimate Email Marketing Benchmarks for 2021: By Industry and Day. Accessed on 10/4/21.
-
SuperOffice. New Study: 50% of B2B Companies Do Not Use Email Marketing. Accessed on 10/4/21.
-
Statista. Percentage of mobile device website traffic worldwide from 1st quarter 2015 to 1st quarter 2021. Accessed on 10/4/21.
-
Litmus Labs. Email Client Market Share. Accessed on 10/4/21.
-
Hubspot. The Ultimate List of Marketing Statistics for 2021. Accessed on 10/4/21.
-
GetResponse. Email Marketing Benchmarks. Accessed on 10/4/21.
-
Statista. Protective actions taken by internet users worldwide over the past year as of February 2019. Accessed on 10/4/21.
-
Statista. Number of sent and received emails per day worldwide from 2017 to 2025. Accessed on 10/4/21.
-
Statista. Percentage of internet users in the United States who use email as of November 2019, by gender. Accessed on 10/4/21.
-
Statista. Percentage of internet users in the United States who use email as of November 2019, by ethnicity. Accessed on 10/4/21.
-
Oberlo. 10 Email Marketing Statistics. Accessed on 10/4/21.
-
GetResponse. Email Marketing and Automation Excellence 2018. Accessed on 10/4/21.
-
Emma. 9 sizzling marketing stats from this summer. Accessed on 10/4/21.
-
Medium.com. The stats don’t lie: discounts and free shipping increase sales. Accessed on 10/4/21.
-
AWeber. 2019 Email Marketing Statistics: We Analyzed 1,000 Emails from Today’s Top Experts. Accessed on 10/4/21.
-
Uplers Email. Best Practices Of Email Signature Marketing. Accessed on 10/4/21.
-
Huffington Post. Is Your Email Sign-Off Annoying? You Might Just Want To Say ‘Thanks’. Accessed on 10/4/21.
-
Inc. 11 Emojis That Make You Look Really Unprofessional at Work. Accessed on 10/5/21.
-
Campaign Monitor. The Real Scoop on Email Emoji in Subject Lines. Accessed on 10/5/21.
-
Wordstream. 75 Staggering Video Marketing Statistics for 2021. Accessed on 10/5/21.
-
Kinsta. 20+ Must-Know Email Marketing Statistics. Accessed on 10/5/21.
- Facts and Figures
- Social Security Statistics
- Social Media Statistics
- Cell Phone Usage Statistics
- Cryptocurrency Statistics
- White Collar Crime Statistics
- Crowdfunding Statistics
- Branding Statistics
- How Many Emails Are Sent Per Day
- Money Laundering Statistics
- Childcare Availability Statistics
- Cold Calling Statistics
- Automation And Job Loss Statistics
- Student Loan Statistics
- Spam Statistics
- Password Statistics
- Ransomware Statistics
- Christmas Spending Statistics
- Average Grocery Cost By State
- Average Screen Time Statistics
- Average Monthly Expenses
- IoT Statistics
- Gen Z Statistics
Author
Chris Kolmar is a co-founder of Zippia and the editor-in-chief of the Zippia career advice blog. He has hired over 50 people in his career, been hired five times, and wants to help you land your next job. His research has been featured on the New York Times, Thrillist, VOX, The Atlantic, and a host of local news. More recently, he's been quoted on USA Today, BusinessInsider, and CNBC.