- Small Business Statistics
Research Summary. Starting a small business is an exciting endeavor, but it’s crucial to be aware of the potential risks, including the likelihood of failure. Understanding the reasons behind business failures can help you navigate common pitfalls and set your venture up for success. Here are some key statistics:
-
22% of startups fail in their first year
-
50% of new businesses fail within the first five years
-
The primary reason small businesses fail is due to cash flow issues.
-
Massachusetts has the lowest small business failure rates, while Washington has the highest.
For a deeper understanding, we’ve categorized the data into the following sections:
Small Business | Top Reasons | Industry | State
Small Business Failure Rate Over Time
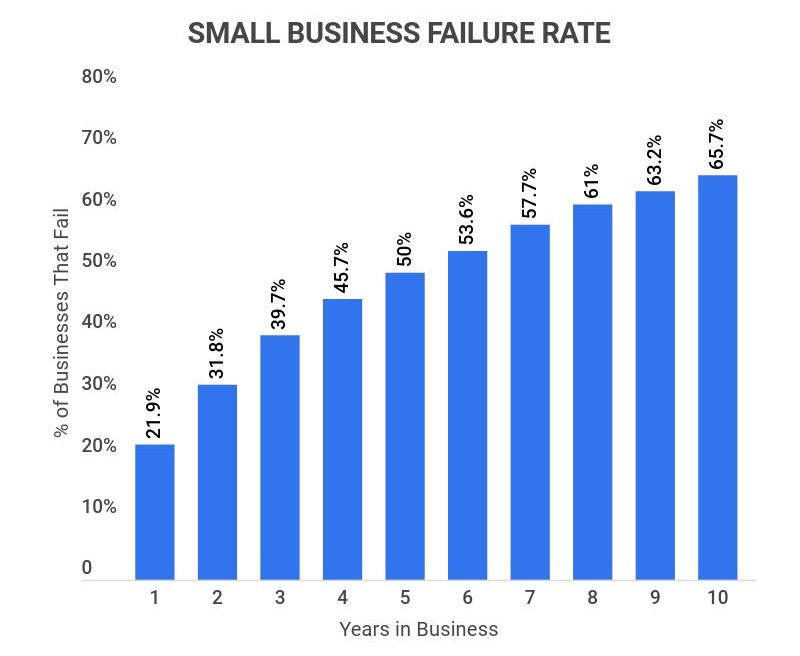
When you launch a business, it’s essential to be in it for the long term. The initial years are particularly critical, and understanding the failure rates during these years can help ensure your business remains viable.
-
In its first year, a business has a failure rate of 21.9%
This indicates a survival rate of approximately 78.1%, suggesting that many businesses experience relative success in their inaugural year.
-
For the second year, the failure rate is 31.8%, leading to a survival rate of 68.2%.
It’s important to note that as businesses progress, the survival rate diminishes while the failure rate escalates. For businesses in their third year, the survival rate is 60.3%, with a failure rate of 39.7%.
In their fourth year, survival drops to 54.3%, and the failure rate climbs to 45.7%. By the fifth year, survival is at 50%, indicating an equal split between success and failure.
-
After ten years, the failure rate reaches 65.7%.
This translates to a survival rate of just 34.3% for businesses that have been operating for a decade.
-
Businesses are most likely to fail within their initial three years.
Statistics suggest that those that survive into their fourth year have about a 90% chance of making it through each subsequent year.

Small Business Statistics
Understanding the failure rates is crucial, but it’s equally important to recognize the scale of the small business landscape. The small business sector can appear crowded, yet the diversity across various industries may yield surprising insights.
-
Over 627,000 new businesses launch each year.
The Small Business Administration (SBA) recognizes this as a significant contribution to the economy.
-
Conversely, approximately 595,000 businesses close annually.
This statistic underscores how challenging it can be to maintain a business, regardless of the owner’s experience.
-
The United States is home to 28.8 million small businesses.
These enterprises represent 97% of all businesses in the U.S., highlighting their critical role in the economy.
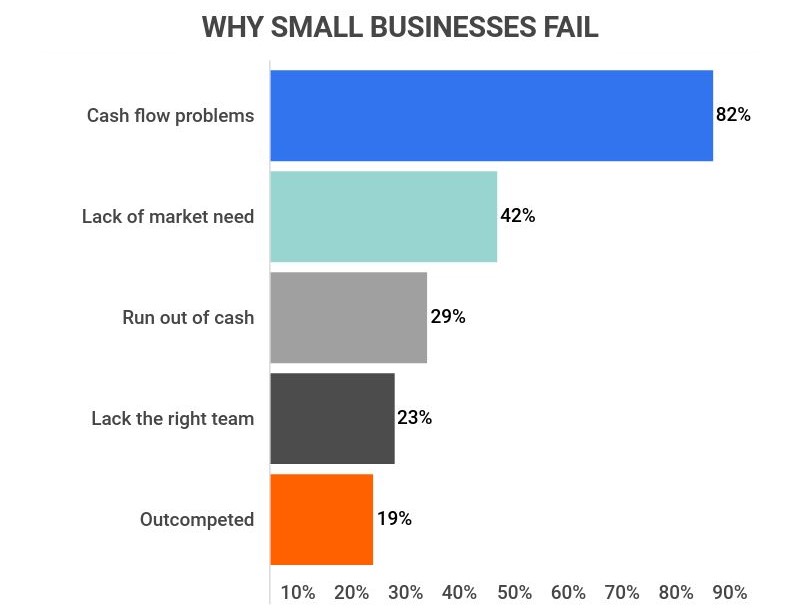
Top Reasons Why Small Businesses Fail
Now that we have a grasp of the relevant statistics, it’s vital to delve into the reasons behind small business failures.
-
The foremost reason for small business failure is cash flow issues.
Approximately 82% of businesses that fail cite cash flow problems, while 42% report insufficient demand for their product or service. Additionally, 29% run out of cash, 23% lack the right team, and 19% face intense competition.
-
In 2020, 42% of small business owners sought loans from large banks, while 43% applied to small banks.
Online lenders accounted for roughly 20% of all business loan applications.
Small Business Failure Rate by Industry
While many small businesses face similar challenges, the issues can vary significantly depending on the industry, service, or product offered. Consider the following insights:
-
Transportation and warehousing, along with construction, are among the hardest-hit industries for small business survival.
75% of transportation and warehousing businesses survive their first year, but this figure dramatically declines by the fifth year, with only 30% still operational. Similarly, 75% of construction businesses also survive their first year, yet only 40% make it to year five.
-
Healthcare and social assistance represent the best industries for small business survival.
85% of healthcare and social assistance businesses thrive in their first year, with 60% still successful by year five.
-
Contrary to popular belief, restaurants do not fail more than other businesses.
This perception often leads to banks viewing this sector as high risk, resulting in difficulties in securing startup funding.
Small Business Failure Rate by Industry
| Industry | % Failure Rate (2015) | % Failure Rate (2016) | % Failure Rate (2017) | % Failure Rate (2018) | % Failure Rate (2019) |
|---|---|---|---|---|---|
| Agriculture, Forestry, Fishing & Hunting | 29 | 25 | 20 | 20 | 12 |
| Real Estate, Rental & Leasing | 35 | 31 | 25 | 24 | 14 |
| Retail Trade | 38 | 33 | 27 | 24 | 15 |
| Arts, Entertainment, & Recreation | 40 | 33 | 27 | 25 | 17 |
| Accommodation & Food Services | 41 | 34 | 30 | 26 | 17 |
| Manufacturing | 39 | 33 | 29 | 26 | 17 |
| Utilities | 41 | 37 | 30 | 25 | 18 |
| Educational Services | 42 | 35 | 30 | 26 | 18 |
| Health Care & Social Services | 44 | 40 | 33 | 25 | 20 |
| Finance & Insurance | 43 | 39 | 33 | 29 | 18 |
| Construction | 42 | 37 | 32 | 30 | 21 |
| Management of Companies & Enterprises | 47 | 42 | 35 | 32 | 19 |
| Transportation & Warehousing | 47 | 42 | 33 | 32 | 23 |
| Wholesale Trade | 48 | 41 | 35 | 30 | 20 |
| Professional, Scientific & Technical Services | 49 | 43 | 37 | 33 | 22 |
| Administrative & Waste Services | 47 | 43 | 37 | 33 | 24 |
| Mining, Quarrying, & Oil and Gas Extraction | 59 | 49 | 37 | 34 | 23 |
| Information | 53 | 47 | 40 | 36 | 24 |
Small Business Failure Rate by State
The geographical location of your business can significantly influence its chances of success. Different states exhibit varying survival and failure rates, as illustrated below.
-
In the last five years, Massachusetts has consistently reported the lowest cumulative failure rate.
In 2019, Massachusetts boasted a failure rate of 19.5%. Montana followed closely with 19%, while California had a 18.2% failure rate.
-
Over the past five years, Washington has exhibited the highest cumulative failure rate.
The state had a failure rate of 36.6% in 2019, significantly higher than the next highest state, which had a 22.3% failure rate. The District of Columbia followed at 22.7%, with Missouri at 24% and Kansas at 25.2%.
States With The Lowest Small Business Failure Rate
| State | % Failure Rate (2015) | % Failure Rate (2019) |
|---|---|---|
| California | 47 | 18 |
| Louisiana | 49 | 18 |
| Montana | 46 | 19 |
| Massachusetts | 46 | 19 |
| Idaho | 49 | 19 |
| Minnesota | 44 | 19 |
| New Mexico | 50 | 19 |
| Mississippi | 48 | 20 |
| Iowa | 46 | 20 |
| Texas | 49 | 20 |
| New Jersey | 50 | 20 |
States With The Highest Small Business Failure Rate
| State | % Failure Rate (2015) | % Failure Rate (2019) |
|---|---|---|
| Washington | 53 | 36 |
| Michigan | 52 | 28 |
| Kansas | 51 | 25 |
| Hawaii | 51 | 24 |
| Rhode Island | 53 | 24 |
| Florida | 50 | 24 |
| Missouri | 53 | 24 |
| Delaware | 54 | 23 |
| Georgia | 53 | 23 |
| Maryland | 49 | 23 |
| New Hampshire | 54 | 23 |
What Percentage of Small Businesses Fail FAQ
-
What industry has the highest small business failure rate?
The transportation and warehousing industry, along with the construction industry, exhibit the highest small business failure rates. Approximately 75% of firms in these sectors survive their first year. However, by the fifth year, only 30% of transportation and warehousing businesses remain, compared to 40% of construction firms.
-
How many small businesses close each year?
Approximately 595,000 businesses close annually. This figure is significant, especially considering that about 627,000 new small businesses open each year, resulting in a net decrease of around 32,000.
-
What percent of small businesses closed in 2020?
60% of businesses that closed during the COVID-19 pandemic in 2020 are permanent closures. The pandemic inflicted severe consequences on small businesses, particularly in urban areas.
Notably, San Francisco faced a 48% closure rate among small businesses during that time.
-
How long do most small businesses last?
The average lifespan of a small business is approximately 8.5 years. 51% of small businesses are ten years old or less, and many experience failure within the first five years.
-
What industry has the highest small business failure rate?
The transportation and warehousing industry has the highest small business failure rate. In the first year, around 75% of transportation and warehousing businesses survive. However, by their fifth year, the failure rate is approximately 70%, indicating that only 30% remain operational.
Construction businesses also share a similar first-year failure rate of 25%, with only 40% surviving by year five, resulting in a 60% failure rate.
-
How many small businesses close each year?
Approximately 595,000 businesses close each year in the United States. While this is a considerable figure, it is offset by the 627,000 businesses that open annually, resulting in a net decrease of about 32,000.
With 28.8 million small businesses in the U.S., accounting for 97% of all businesses, the average failure rate for the first year is 21.9%, which increases over time. Most failures occur within the first three years, but survival rates improve significantly after the fourth year, though businesses that have survived ten years still face a failure rate of 65.7%.
-
What percent of small businesses closed in 2020?
9% of small businesses closed in the second quarter of 2020. This was four percentage points higher than the average closing rates of 2019, with significant losses attributed to the pandemic.
In total, more than 1.2 million businesses closed in the first half of 2020, resulting in around 3 million job losses.
The Federal Reserve estimates that, based on historical trends, approximately half of these closures will be permanent, though the full impact of the pandemic will take time to assess accurately.
-
How long does the average small business last?
On average, a small business lasts about eight and a half years. 51% of small businesses are ten years old or less, and 50% fail within the first five years. While surviving the first year is a crucial milestone, the first four to five years are critical, as failure rates continue to rise.
Cash flow issues remain a primary reason for business closures, with 82% of failed businesses citing cash flow problems as a significant factor.
-
What type of business is most likely to succeed?
Healthcare and social assistance businesses are the most likely to succeed. These businesses typically have only a 15% failure rate in their first year, with 60% continuing to thrive by the fifth year. Their success is often due to the essential services they provide, ensuring a steady demand regardless of external circumstances.
Interestingly, in 2019, businesses in agriculture, forestry, fishing, and hunting saw a notably low failure rate of just 12%.
Conclusion
Embarking on the journey of entrepreneurship can be daunting. While uncertainty looms, it’s vital to equip yourself with knowledge to enhance your chances of success.
While starting a small business entails risks, understanding the data can alleviate fears and inform strategies for growth.
In summary, running a business is challenging. Many factors contribute to small business failures, but managing finances and cash flow is paramount. This remains a crucial point of focus for entrepreneurs, as cash flow challenges are a leading cause of business closures.
Ultimately, opportunities abound for innovation and growth in the small business sector, bolstered by statistics that reflect their resilience and significance in the economy.
References
-
AdvisorSmith. “What Percentages of Small Businesses Fail?” Accessed November 17, 2021.
-
Chron. “Information on Small Business Startups.” Accessed November 17, 2021.
-
Visual Capitalist. “Why Do Businesses Fail?” Accessed November 17, 2021.
-
Insider. “Here’s why small businesses fail.” Accessed November 17, 2021.
-
Finder. “Business loan statistics.” Accessed November 17, 2021.
- Small Business Statistics
Author
Caitlin Mazur is a freelance writer at Zippia. Caitlin is passionate about helping Zippia’s readers land the jobs of their dreams by offering content that discusses job-seeking advice based on experience and extensive research. Caitlin holds a degree in English from Saint Joseph’s University in Philadelphia, PA.