- Income Statistics
- Average PTO Days
- What Percentage of Americans Live Paycheck to Paycheck?
- Average American Income
- Millionaire Statistics
- Average Salary out of College
- Average Bonus Statistics
- Minimum Wage Statistics
- Union Benefits Statistics
- Savings Statistics
- Average Annual Raise
- Income Inequality Statistics
- How Many People Make Over 100k?
- Average 401(k) Sstatistics
- Average Net Worth Statistics
- $100k After-Tax Income By State
- Average Global Income
Research Summary. Effectively managing finances is a challenge for many Americans, regardless of their income level. A significant portion of the population continues to live paycheck to paycheck, highlighting ongoing income insecurity. Here’s what our data analysis reveals:
-
125 million Americans live paycheck to paycheck.
-
63% of Americans report living paycheck to paycheck as of early 2026.
-
Financial stability is elusive; 60% of millennials earning over $100,000 annually still live paycheck to paycheck.
-
40% of Americans can cover a $1,000 emergency using their savings.
-
Nearly 75% of American workers are in debt, with half of those believing they will remain in debt indefinitely.
For deeper insights, our analysis has been categorized as follows:
Emergency Savings | Demographics | Impact of Economic Shifts | Causes

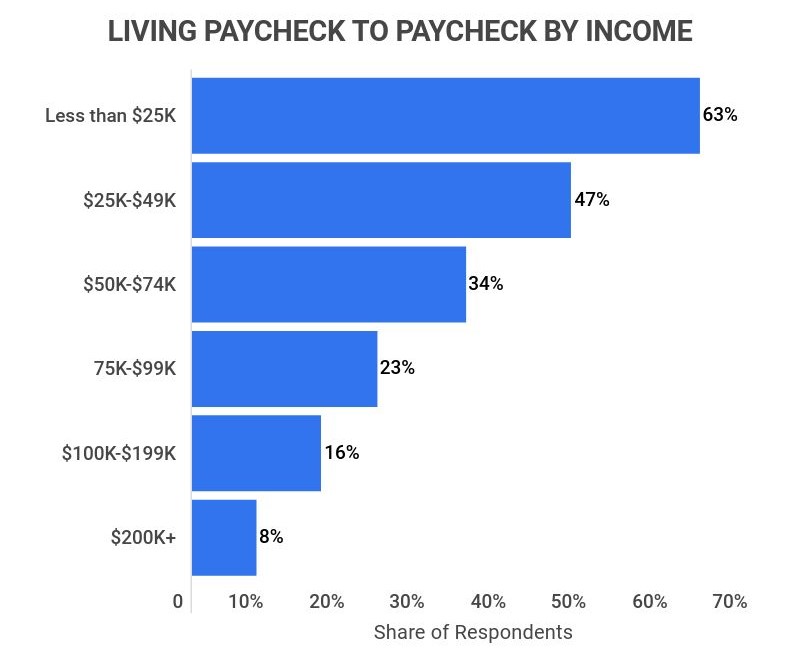
How Many Americans Live Paycheck to Paycheck by Income
-
63% of Americans live paycheck to paycheck.
Here’s a breakdown by income level:
-
Among those earning over $100,000 a year, 40% live paycheck to paycheck.
-
For individuals earning between $50,000 and $100,000 annually, 53% live paycheck to paycheck.
-
Of those earning less than $50,000 a year, 72% live paycheck to paycheck.
-
-
21% of U.S. adults struggle to pay their bills.
This indicates that these individuals spend most or all of their income monthly, leaving little to no room for savings.
Here’s the breakdown by income level:
-
Among those earning over $100,000 annually, 12% struggle to pay their bills.
-
For those earning between $50,000 and $100,000 annually, 18% struggle to pay their bills.
-
33% of individuals earning less than $50,000 annually report difficulty in paying their bills.
-
-
Almost 75% of the American workforce is in debt.
Additionally, over 50% of those in debt expect to remain in debt long-term.
How Many Americans Have Emergency Savings?
-
60% of Americans cannot cover a $1,000 emergency with cash from their savings.
-
About 30% of U.S. adults lack any emergency savings.
-
The average American can manage for ten weeks without a paycheck.
-
38% of Americans have at least three months’ worth of living expenses saved, which is the minimum recommended by financial experts.
-
For those who struggle to pay their bills, the average savings amount is $4,000.

How Many Americans Live Paycheck to Paycheck by Demographics
-
Millennials and Gen Xers have similar rates of living paycheck to paycheck – just under 60%.
The percentages for each generation are as follows:
-
Millennials: 58% live paycheck to paycheck.
-
Gen Xers: 59% live paycheck to paycheck.
-
Baby Boomers: 47% live paycheck to paycheck.
-
-
55% of females compared to 51% of males report living paycheck to paycheck.
Women generally feel they can sustain themselves for about eight weeks without income, while men estimate around 11 weeks.
-
40% of households lack sufficient savings to live below the poverty line for three months, with higher rates among Black and Latino households.
62.5% of Latino households and 62.7% of Black households have less than $6,275 saved, the amount needed for a family of four to live at a poverty-level income for three months.
Economic Shifts Impacting Americans Living Paycheck to Paycheck
-
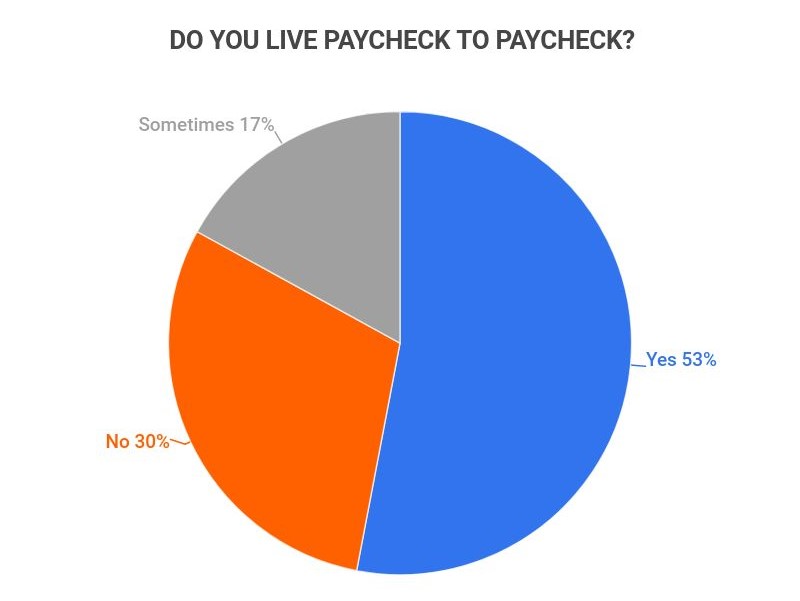
Prior to recent economic shifts, 53% of surveyed U.S. adults reported not living paycheck to paycheck, compared to 63% who have done so in the wake of these changes.
-
Nearly 40% of Americans accessed their savings during recent economic downturns.
-
73.3% of those who tapped into their savings used half of their emergency funds.
Why Do Americans Live Paycheck to Paycheck?
-
Since 2000, housing costs have risen by over 31%, while wages have increased by only about 10.4%.
This disparity means a larger share of income goes towards housing, limiting funds available for other expenses or savings.
-
Healthcare costs have surged by over 55% since 2000, while wages have only seen a 10.4% increase.
This has forced many Americans to allocate a significant portion of their income to insurance premiums and medical expenses, leading to more debt.
-
The incidence of student loan debt has doubled since 2016 compared to 1998.
The median student debt has increased from $12,800 for Gen Xers in their 20s and 30s to $19,000 for millennials at the same age, reflecting rising college costs that have outpaced wage growth.
-
Millennials spend an average of $478 monthly on nonessential items.
This includes dining out, vacations, luxury purchases, and entertainment. This figure is higher than Baby Boomers’ average of $359 but still less than Gen Xers’ average of $587.
Experts indicate that this spending level is often too high for millennials, who may struggle with financial literacy and managing rising costs in other areas.
-
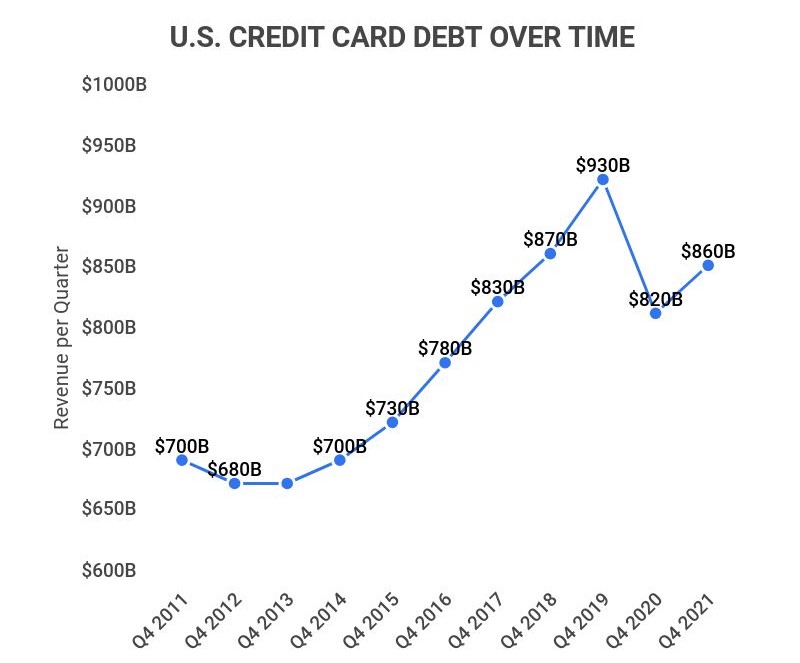
From 2011 to 2021, total U.S. credit card debt rose from $690 billion to $790 billion.
While this figure has fluctuated, the overall trend remains upward.
As of the second quarter of 2021, the average cardholder had $5,668 in credit card debt.
How Many Americans Live Paycheck To Paycheck FAQ
-
How many people live paycheck to paycheck?
Approximately 125 million Americans live paycheck to paycheck. This represents 63% of the adult U.S. population.
Among those earning less than $50,000 annually, 72% live paycheck to paycheck, compared to 53% of those earning between $50,000 and $100,000, and 40% of those earning over $100,000.
-
How many Americans have no savings?
About 30% of Americans lack any savings. This means that roughly one-third of the adult population does not have funds set aside for emergencies or unforeseen expenses.
While 38% of Americans have at least three months of living expenses saved, 70% still maintain less than $15,000 in savings.
-
What is the average credit card debt for Americans?
The average credit card debt for Americans is $5,668. In total, Americans owe $790 billion in credit card debt.
This reflects an increase from $690 billion in 2011, but a decrease from a peak of $930 billion at the end of 2019.
-
What percentage of working Americans are in debt?
75% of working Americans are in debt. Additionally, over 50% believe they will remain in debt for the foreseeable future.
Most of these individuals fall within the demographic earning between $50,000 and $99,999, with 70% of this group carrying debt.
Conclusion
As of 2026, approximately 63% or 125 million Americans live paycheck to paycheck. This statistic indicates that a significant portion of the population would struggle to meet their financial obligations if they lost their monthly income.
Individuals across all income levels are affected, with 40% of those earning over $100,000, 53% of those earning between $50,000 and $100,000, and 72% of those earning less than $50,000 living paycheck to paycheck.
Experts attribute these issues to various factors, including financial illiteracy, inadequate savings, rising debt, increased living expenses, and stagnant wages. The economic shifts of recent years have further exacerbated these challenges, pushing many to deplete their emergency savings.
References
-
PR Newswire. “Nearly 40 Percent of Americans with Annual Incomes Over $100,000 Live Paycheck-to-Paycheck.” Accessed on January 20, 2026.
-
Business Insider. “60% of Millennials Earning Over $100,000 Say They’re Living Paycheck to Paycheck.” Accessed on January 20, 2026.
-
The Washington Post. “A Breakdown of What Living Paycheck to Paycheck Looks Like.” Accessed on January 20, 2026.
-
Forbes. “78% of Workers Live Paycheck To Paycheck.” Accessed on January 20, 2026.
-
Magnify Money. “Survey: 53% of Americans Live Paycheck to Paycheck.” Accessed on January 20, 2026.
-
Nonprofit Quarterly. “Is Living Paycheck to Paycheck the New Normal for Middle-Class America?” Accessed on January 20, 2026.
-
NPR. “Paycheck-To-Paycheck Nation: Why Even Americans With Higher Income Struggle With Bills.” Accessed on January 20, 2026.
-
CNBC. “62% of Millennials Say They’re Living Paycheck to Paycheck.” Accessed on January 20, 2026.
-
MoneyGeek. “Average Credit Card Debt in America.” Accessed on January 20, 2026.
- Income Statistics
- Average PTO Days
- What Percentage of Americans Live Paycheck to Paycheck?
- Average American Income
- Millionaire Statistics
- Average Salary out of College
- Average Bonus Statistics
- Minimum Wage Statistics
- Union Benefits Statistics
- Savings Statistics
- Average Annual Raise
- Income Inequality Statistics
- How Many People Make Over 100k?
- Average 401(k) Sstatistics
- Average Net Worth Statistics
- $100k After-Tax Income By State
- Average Global Income
Author
Abby is a writer who is passionate about the power of story. Whether it’s communicating complicated topics in a clear way or helping readers connect with another person or place from the comfort of their couch. Abby attended Oral Roberts University in Tulsa, Oklahoma, where she earned a degree in writing with concentrations in journalism and business.