- Industry Statistics
- Wedding Industry Statistics
- Yoga Industry Statistics
- Music Industry Statistics
- Landscaping Industry Statistics
- Bicycle Industry Statistics
- Coffee Industry Statistics
- Car Rental Industry Statistics
- Home Improvement Industry Statistics
- Insurance Industry Statistics
- Supplements Industry Statistics
- Golf Industry Statistics
- Fitness Industry Statistics
- US Media And Entertainment Industry Statistics
- Firearm Industry Statistics
- Financial Services Industry Statistics
- Health And Wellness Industry Statistics
- Trucking Industry Statistics
- Wine Industry Statistics
- Pet Industry Statistics
- Mobile App Industry Statistics
- Digital Marketing Industry Statistics
- Hotel Industry Statistics
- Retail Statistics
- Robotics Industry Statistics
- Jewelry Industry Statistics
- Appointment Scheduling statistics
- Restaurant Industry Statistics
- Food Delivery Statistics
- Food Truck Industry
- Fashion Industry
- Real Estate Industry
- US Film Industry
- US Beverage Industry
- USu202fFast Food Restaurants
- US Construction Industry
- US Book Industry
- Cosmetics Industry
- US Food Retail Industry
- US Pharmaceutical Industry
- US Healthcare Industry
- Airline Industry
- Automobile Industry
- Transportation Industry Statistics
- Event Industry Statistics
- Project Management Statistics
- Oil And Gas Industry Statistics
- Nursing Home Statistics
- Nursing Shortage Statistics
- Nursing Statistics
Research Summary. The U.S. insurance industry has undergone significant transformation and growth driven by economic expansion, favorable interest rates, and enhanced investment income. Based on our comprehensive research, here are the key insights:
-
As of 2026, the U.S. insurance industry’s net premiums written are estimated to reach $1.5 trillion.
-
There are approximately 5,954 insurance companies operating across the United States.
-
The U.S. insurance sector employs around 2.9 million individuals.
-
The insurance industry contributes about 3.1% to the nation’s total GDP.
For a detailed analysis, we have categorized the data into the following sections:
Types of Insurance | Employment | Companies | Industry Response | American Insurance Rates | Trends and Projections

General Insurance Industry Statistics
The insurance industry plays a crucial role not only in the U.S. economy but also on a global scale. Millions worldwide rely on various insurance products, from home coverage to auto protection. Here are some general insights into the insurance sector:
-
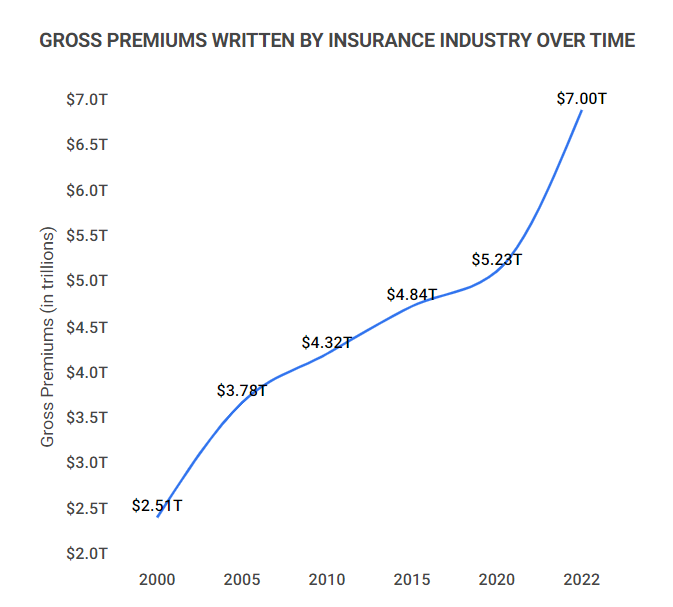
Global annual insurance premiums surpassed $7.5 trillion in 2023.
After a notable decline in 2019 (to $5.03 trillion), global gross insurance premiums rebounded significantly, increasing by over 40% in recent years.
-
Private health insurance spending in the U.S. represents 28% of National Health Expenditure.
Despite a slight decline in private health insurance expenditure in 2020, it still constitutes a substantial portion of healthcare spending in the United States.
-
The average profit margin for the insurance industry is between 3-5%.
This figure varies significantly by insurance type, with some companies achieving margins exceeding 20%, while others may operate at minimal profit.
-
There are 5,954 insurance companies operating throughout the United States.
New York leads with 577 companies, followed by Florida (437), Texas (403), Illinois (337), and Wisconsin (334). The states with the fewest insurance companies are Alaska and Wyoming, each with five.
State Number of Insurance Companies New York 577 Florida 437 Texas 403 Illinois 337 Wisconsin 334 Pennsylvania 254 Ohio 245 Iowa 220 Missouri 178 Minnesota 152 Indiana 149 Delaware 146 California 132 Michigan 127 New Jersey 118 Arizona 117 Vermont 112 Louisiana 105 Nebraska 103 Connecticut 103 Utah 94 Georgia 89 Massachusetts 81 North Carolina 81 Oklahoma 78 South Carolina 75 Tennessee 67 Virginia 66 Maryland 61 New Hampshire 58 Arkansas 56 Kentucky 56 Oregon 49 Kansas 47 Colorado 46 Hawaii 46 Nevada 45 Mississippi 42 Alabama 40 Montana 40 South Dakota 38 New Mexico 37 Washington 35 North Dakota 30 West Virginia 29 Rhode Island 28 Idaho 17 Maine 15 Alaska 5 Wyoming 5
Insurance Industry Statistics by Types of Insurance
The insurance landscape encompasses a wide variety of products, from life insurance that provides financial security to property insurance that protects against unexpected damages. Here’s a closer look at the various types of insurance and their characteristics:
-
Property and casualty insurance companies have the highest net profit margin among insurance types, averaging 23.26%.
This profitability is driven by declining incidents of property crime, with burglary rates dropping by approximately 48.5% since 2010. The increase in net income for property and casualty insurance companies was substantial, rising from $38.7 billion to $57.9 billion between 2017 and 2018 (a 49.5% increase).
-
Property and casualty premiums constitute 48% of all insurance premiums.
In 2021, life and annuity insurers accounted for 52% of the $1.5 trillion in net premiums written, while property and casualty insurers contributed 48%.
-
16% of consumers express a need for life insurance but currently lack coverage.
This equates to approximately 41 million potential customers, many of whom face financial challenges following the loss of a primary income earner, as nearly 33% of families struggle to manage daily expenses in the month following such an event.
-
38% of Americans purchase travel insurance.
Primarily, consumers seek travel insurance for cancellation protection, with 88% of purchasers citing this as their main reason.
U.S. Insurance Industry Statistics by Employment
The insurance industry is a significant employer in the U.S., offering a wide range of job opportunities. Here are some key employment statistics:
-
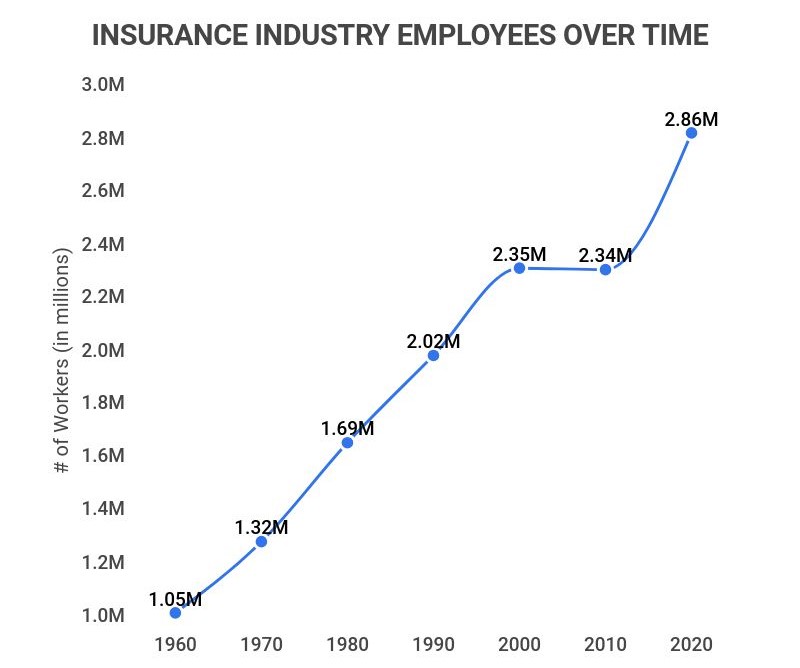
The U.S. insurance industry employs approximately 2.9 million individuals.
The workforce has been steadily increasing, with a rise from 2.54 million employees in 2015, representing a growth of 12.6% over five years.
-
The unemployment rate in the insurance industry is 61% lower than the national average.
As of early 2026, the unemployment rate in the insurance sector is 1.4%, down from 2.5% in 2021, significantly better than the national average of 3.6%.
-
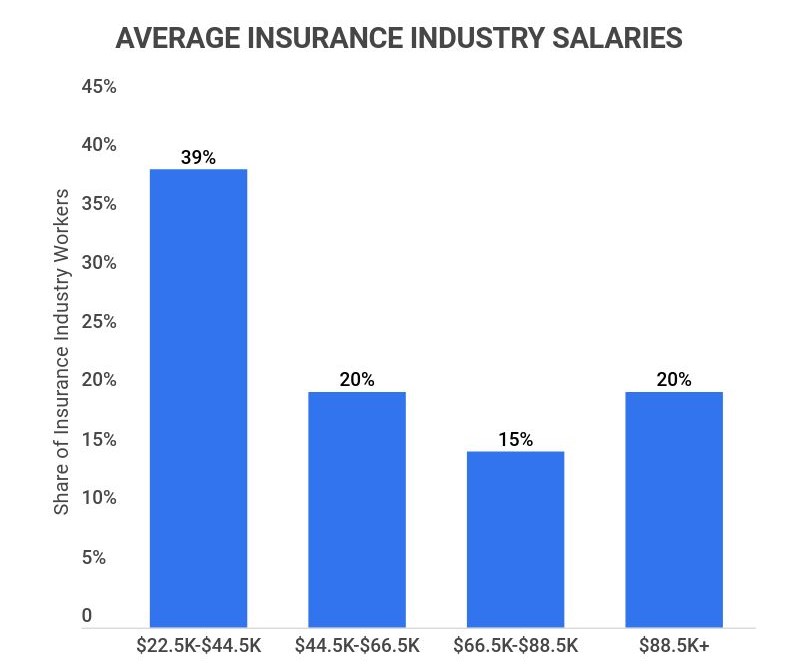
The average annual salary for an insurance industry employee is $67,421.
However, compensation varies widely depending on factors such as job role, geographic location, and required qualifications, with salaries ranging from $22,500 to $143,500.
-
During the initial phase of the COVID-19 pandemic, unemployment in the insurance sector peaked at only 3.9%.
This increase was minimal compared to the national unemployment rate, which surged to 14.7% at the same time.
-
64% of insurance companies are worried about rising labor costs.
This concern is impacting quality standards and customer experience, with 48% of insurers believing that skill shortages will affect service quality.
-
Only 4% of Millennials express interest in pursuing careers in the insurance industry.
This trend poses a challenge, as 75% of the global workforce consists of Millennials, and experts project that 25% of current insurance professionals will retire within the next three years without sufficient replacements.
Insurance Industry Statistics by Insurance Companies
From household names like Progressive to Allstate, U.S. insurance companies are known for their impactful advertising and brand recognition. Here are some insights into their market presence:
-
Berkshire Hathaway is the largest insurance company globally, valued at $714 billion.
This U.S.-based publicly-traded non-health insurance company outperforms all its competitors. The other top five include United Healthcare ($448 billion), Ping An Insurance ($141 billion), CVS ($136 billion), and AIA Group ($123 billion).
-
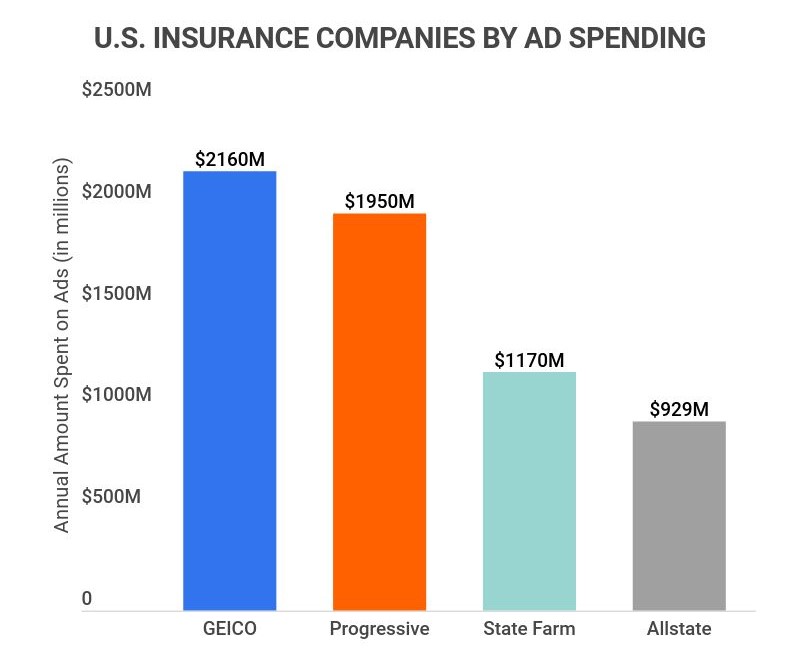
Berkshire Hathaway’s GEICO Corp. invested $2.16 billion in advertising in 2019.
While it leads in ad spending, other significant spenders include Progressive ($1.95 billion), State Farm ($1.17 billion), and Allstate ($929.9 million).
Insurance Industry Statistics by Industry Response
The COVID-19 pandemic has left an indelible mark on the insurance industry. Here are the most significant impacts:
-
15% of Americans report they are more likely to purchase life insurance due to the pandemic’s effects.
-
Since the pandemic began, the take-up rate for cyber insurance has surged by 78%.
-
In 2020, Progressive experienced a year-over-year premium increase of 30%.
-
Auto insurance rates rose by 5% in 2022.
-
Within the next five years, insurers are expected to reduce operational costs by 25%.
Insurance Industry Statistics by American Insurance Rates
The U.S. insurance industry is the largest globally, with many Americans required to maintain various forms of insurance. Here’s a closer look at American insurance rates:
-
23% of Americans lack a life insurance policy.
The top reasons for this include affordability (38%), perceived value (29%), lack of dependents (28%), and feeling too young to consider it (25%).

-
9.6% of Americans are without any form of health insurance.
This statistic highlights the ongoing challenges many face in accessing healthcare, a marked improvement from the one in six adults who were uninsured prior to the Affordable Care Act in 2010.
-
Inadequate health insurance contributes to 67% of American bankruptcies.
Americans spent $388.6 billion out of pocket on healthcare costs in 2020, while private health insurance covered $1.15 trillion in expenses.
-
New Hampshire and Virginia do not require auto insurance.
These states are the only exceptions among the 50 states, while most Americans pay an average of $1,655 annually for mandatory auto insurance.
Insurance Industry Statistics Trends and Projections
The insurance industry is poised for continued growth and price increases in the coming years. Here are some trends and projections:
-
The industry saw nearly 13% growth between 2020 and 2021.
-
The percentage of customers purchasing insurance online grew from 17% to 29% between 2011 and 2020.
-
Up to 25% of insurance processes are anticipated to be automated by 2025.
-
40% of Chief Information Officers increased their AI investment in 2021.
-
The global insurance sector is projected to have a CAGR of 8.5% through 2028.
Insurance Industry Statistics FAQ
-
How much is the U.S. insurance industry worth?
The U.S. insurance industry is valued at $1.5 trillion (in written net premiums). This figure indicates that life and annuity insurers make up 52%, while property and casualty insurers comprise approximately 48%.
It’s important to note that health insurance is generally considered a separate category, meaning the overall value of the U.S. insurance industry is likely even higher than reported.
-
What are the average health insurance margins?
The average margins in health insurance can be as low as 2%-3%. For instance, in 2019, the health insurance sector reported earnings of $22 billion with a profit margin of only 3% due to high healthcare costs and associated risks.
-
Is the U.S. insurance industry growing?
Yes, the U.S. insurance industry is experiencing growth. The global industry is projected to have a CAGR of 8.5% through 2028, with notable growth in specific sectors:
-
Net income for property and casualty insurance companies saw a significant increase from $38.7 billion to $57.9 billion (49.5%) between 2017 and 2018.
-
15% of Americans indicate they are more likely to purchase life insurance due to the pandemic.
-
The take-up rate for cyber insurance has surged by 78% since the pandemic began.
These examples reflect a positive outlook for sustained growth and rising premiums in the industry.
-
-
Who is the biggest insurance company in the U.S.?
The largest insurance company in the U.S. and the world is Berkshire Hathaway. Valued at $714 billion, it owns several prominent brands, including GEICO, Duracell, and Dairy Queen.
Berkshire Hathaway significantly outperforms its competitors, with United Healthcare, Ping An Insurance, CVS, and AIA Group rounding out the top five.
-
How many insurance companies are there in the U.S.?
There are 5,954 insurance companies operating in the United States. New York leads with 577 companies, while Florida (437), Texas (403), Illinois (337), and Wisconsin (334) follow. Alaska and Wyoming have the fewest, with just five companies each.
-
What percentage of the U.S. economy is insurance?
The finance and insurance sectors represent 7.4% of U.S. GDP, with insurance alone accounting for 3.1% of total GDP. This positions the insurance industry as the 11th largest contributor to the U.S. GDP.
-
What are the main sectors of the insurance industry?
There are four primary sectors within the insurance industry:
-
Life & Health Insurance: This sector encompasses life insurance, annuities, and health insurance, all vital for personal financial security and healthcare needs.
-
General Insurance: This category includes property and casualty insurance, providing coverage for losses due to disasters or accidents, enabling recovery and continuity.
-
Specialty Insurance: Focused on financial activities, this sector protects clients and lenders from risks associated with non-standard contracts or borrowers.
-
Reinsurance: Providing a safety net for insurers, this sector aims to protect against catastrophic losses, essentially insurance for insurance companies.
-
Conclusion
Valued at $1.5 trillion, the U.S. insurance industry is a cornerstone of the nation’s economy, contributing approximately 3.1% to the overall GDP.
Looking ahead, the industry is positioned for a prosperous future, driven by increasing salaries, technological advancements like AI, and ongoing growth trends. The global insurance landscape, spanning health, property, and casualty insurance, is expected to witness continued expansion in the forthcoming years.
Experts forecast a CAGR of 8.5% through 2028.
Sources:
-
Statista. “Gross premiums written by the insurance industry worldwide 2000 to 2020.” Accessed on April 6th, 2022.
-
CMS. “NHE Fact Sheet.” Accessed on April 6th, 2022.
-
Investopedia. “What Are the Usual Profit Margins for Companies in the Insurance Sector?” Accessed on April 6th, 2022.
-
NAIC. “U.S. Property & Casualty Insurance Industry.” Accessed on April 6th, 2022.
-
III. “Facts + Statistics: Life insurance.” Accessed on April 6th, 2022.
-
TAC. “Stats: 38 Percent of Americans Purchase Travel Insurance.” Accessed on April 6th, 2022.
-
Statista. “Number of employees in the insurance industry in the United States from 1960 to 2020.” Accessed on April 7th, 2022.
-
NU. “Insurance unemployment rises to 2.5% in May.” Accessed on April 7th, 2022.
-
ZipRecruiter. “Insurance Industry Salary.” Accessed on April 7th, 2022.
-
Insurance Business. “Job market instability gives insurance industry chance to shine.” Accessed on April 7th, 2022.
-
Brown & Joseph. “Attracting Millennials to the Insurance Industry: A Complete Guide.” Accessed on April 7th, 2022.
-
Investopedia. “Top 10 Insurance Companies by the Metrics.” Accessed on April 7th, 2022.
-
S&P Global. “Insurers that spent the most on advertising in 2020.” Accessed on April 7th, 2022.
-
PWC. “Ready and resilient: Insurance strategy for a COVID-19 world.” Accessed on April 7th, 2022.
-
S&P Global. “How Covid-19 Has Changed Insurance.” Accessed on April 7th, 2022.
-
Fox Business. “Nearly a quarter of Americans don’t have life insurance, survey claims.” Accessed on April 7th, 2022.
-
Motor1. “States Where Car Insurance Is Not Mandatory (2022).” Accessed on April 7th, 2022.
-
AI Multiple. “Top 6 Digital Transformation Applications in Insurance in 2022.” Accessed on April 7th, 2022.
-
NU. “Commercial insurance to see 8.5% CAGR through 2028.” Accessed on April 7th, 2022.
-
Atlas Magazine. “Distribution of insurance companies in USA per State.” Accessed on April 7th, 2022.
- Industry Statistics
- Wedding Industry Statistics
- Yoga Industry Statistics
- Music Industry Statistics
- Landscaping Industry Statistics
- Bicycle Industry Statistics
- Coffee Industry Statistics
- Car Rental Industry Statistics
- Home Improvement Industry Statistics
- Insurance Industry Statistics
- Supplements Industry Statistics
- Golf Industry Statistics
- Fitness Industry Statistics
- US Media And Entertainment Industry Statistics
- Firearm Industry Statistics
- Financial Services Industry Statistics
- Health And Wellness Industry Statistics
- Trucking Industry Statistics
- Wine Industry Statistics
- Pet Industry Statistics
- Mobile App Industry Statistics
- Digital Marketing Industry Statistics
- Hotel Industry Statistics
- Retail Statistics
- Robotics Industry Statistics
- Jewelry Industry Statistics
- Appointment Scheduling statistics
- Restaurant Industry Statistics
- Food Delivery Statistics
- Food Truck Industry
- Fashion Industry
- Real Estate Industry
- US Film Industry
- US Beverage Industry
- USu202fFast Food Restaurants
- US Construction Industry
- US Book Industry
- Cosmetics Industry
- US Food Retail Industry
- US Pharmaceutical Industry
- US Healthcare Industry
- Airline Industry
- Automobile Industry
- Transportation Industry Statistics
- Event Industry Statistics
- Project Management Statistics
- Oil And Gas Industry Statistics
- Nursing Home Statistics
- Nursing Shortage Statistics
- Nursing Statistics
Author
Jack Flynn is a writer for Zippia. In his professional career he’s written over 100 research papers, articles and blog posts. Some of his most popular published works include his writing about economic terms and research into job classifications. Jack received his BS from Hampshire College.