40+ Trending Facebook Statistics [2026]: Revenue, Usage, Demographics Statistics For Marketers
Research Summary. Facebook continues to be a cornerstone in contemporary marketing, social networking, and information dissemination, maintaining its relevance into 2026. Below are key statistics highlighting the current landscape of Facebook.
-
Facebook boasts 2.95 billion global monthly active users.
-
In the U.S., there are approximately 243.58 million monthly active users.
-
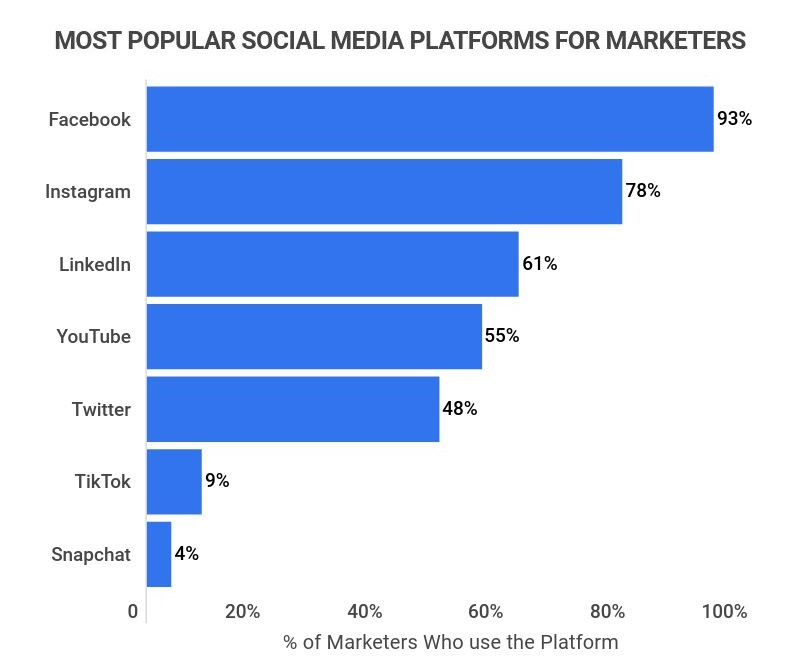
93% of marketers utilize Facebook for advertising.
-
93.7% of businesses maintain a presence on Facebook.
-
The largest demographic of Facebook users are 25 to 34-year-olds.
For more detailed insights, explore our breakdowns:
Global Stats | Marketers | Advertisement Data | User Behavior | American Users | User Data | Videos | Trends
General Facebook Statistics
-
Facebook remains the leader in monthly active users across all social media platforms.
As of January 2026, Facebook has maintained its status with 2.95 billion monthly active users, solidifying its position as the most popular social media network globally. Here’s a comparison of the top five social media networks:
Monthly Active Users By Social Media Network
Social Media Network Monthly Active Users Facebook 2.95 billion YouTube 2.51 billion WhatsApp 2.0 billion Instagram 2.0 billion Weixin/WeChat 1.30 billion -
As of 2022, Facebook generated approximately $116.6 billion in revenue.
Meta’s portfolio includes Facebook, Instagram, WhatsApp, and Oculus, among others.
-
Nearly 98% of Facebook’s revenue is derived from digital advertising.
In 2022, out of Meta’s total revenue of $116.6 billion, $114.8 billion was attributed to advertising.
Global Facebook Statistics
-
Globally, approximately 2.95 billion people use Facebook monthly.
When considering all of Meta’s products, the total monthly user base rises to 3.64 billion, with Facebook users constituting nearly 80% of this number.
-
More than 10% of Facebook users are from the U.S.
In 2022, there were about 297.14 million monthly active users in the U.S.
-
India leads with the highest number of Facebook users, totaling 314.6 million.
Below are the top ten countries by the number of Facebook users as of January 2026:
Number of Facebook Users by Country
Country Number of Facebook Users India 314.6 million The United States 175 million Indonesia 119.9 million Brazil 109.05 million Mexico 83.75 million Philippines 80.3 million Vietnam 66.2 million Thailand 48.1 million Bangladesh 43.25 million Egypt 42 million
Facebook Statistics for Marketers and Advertisers
-
Over 200 million businesses globally utilize Facebook’s business tools, predominantly comprising small businesses.
-
The average cost-per-click for Facebook ads is approximately $0.43.
-
93% of marketers use Facebook for their advertising efforts, compared to 78% who utilize Instagram.
-
Facebook commands 25.2% of the U.S. digital advertising market, the largest share of any online advertising platform, including Google.
-
There are over 10 million active advertisers on Facebook.
-
The average eCommerce click-through rate (CTR) on Facebook is around 3%.
-
63% of marketers consider Facebook the most effective social media channel.
Facebook Statistics by User Advertisement Data
-
Approximately 15% of Americans report making a purchase via a link on social media.
-
78% of Americans aged 18 to 34 have discovered products to buy on Facebook.
-
94% of Facebook’s advertising revenue is generated from mobile ads.
-
52% of consumers have purchased from a brand they follow on Facebook.
Facebook Statistics by User Behavior
-
31% of Americans regularly use Facebook for news consumption.
-
The average U.S. adult spends 33 minutes daily on Facebook.
-
70% of adult U.S. Facebook users access the platform daily.
Facebook Statistics by American Users
-
69% of U.S. adults report using Facebook.
YouTube is the only platform with a higher usage rate at 81%, while Instagram follows with 40% of U.S. adults using it.
-
77% of adult U.S. women are Facebook users.
In comparison, 61% of adult U.S. men report using the platform.
-
72% of U.S. Democrats use Facebook.
Conversely, 69% of U.S. adults identifying as Republicans also use the platform, reflecting a narrow margin in political affiliation.
Facebook Statistics by User Data
-
Each month, 1.8 billion people use Facebook Groups.
-
43.2% of worldwide Facebook users are male, while 56.8% are female.
-
19% of Facebook users in the U.S. utilize the platform to follow brands and companies.
-
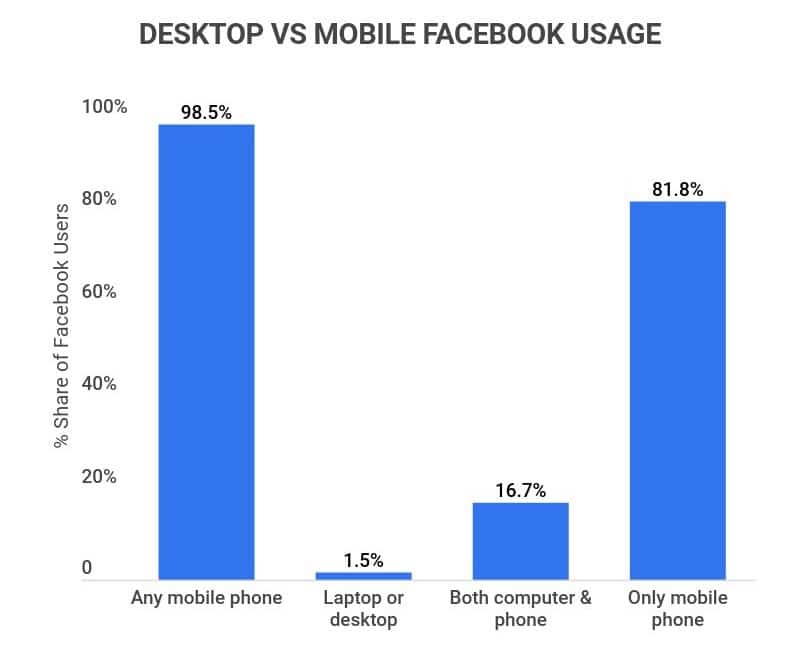
81.8% of Facebook users access the platform via mobile devices, whether through the app or a browser.
Facebook Statistics by Facebook Videos
-
Facebook users watch 100 million hours of video content daily.
-
85% of Facebook video views occur without sound.
-
Vertical videos on Facebook achieve higher engagement rates at 0.68%, compared to landscape (0.34%) and square (0.26%) formats.
-
60.8% of social media users who watch videos under ten minutes prefer Facebook for their viewing.
Facebook Trends and Projections
-
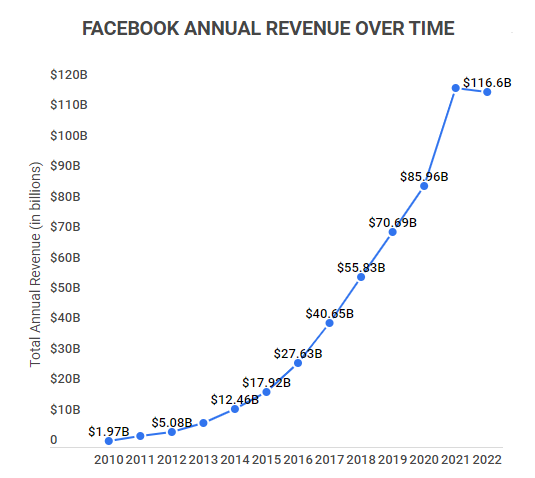
Meta’s (formerly Facebook) annual revenue surged from $1.97 billion in 2010 to $116.6 billion in 2022.
This total for 2022 includes revenue from Meta’s Reality Labs, which produces VR products. Without this revenue, the total would be $115.66 billion. Here’s a historical view of Meta’s annual revenue since 2010:
Facebook Annual Revenue (2010 – 2022)
Year Total Annual Revenue 2022 $116.6 billion 2021 $117.93 billion 2020 $85.97 billion 2019 $70.67 billion 2018 $55.84 billion 2017 $40.65 billion 2016 $27.64 billion 2015 $17.93 billion 2014 $12.47 billion 2013 $7.87 billion 2012 $5.09 billion 2011 $3.71 billion 2010 $1.97 billion -
Facebook grew from 608 million monthly active users in 2010 to 2.95 billion in 2022.
Below is a year-by-year breakdown of Facebook’s monthly active users from 2010 to 2022:
Number of Monthly Active Users for Facebook (2011-2022)
Year Number of Monthly Active Users 2022 2.95 billion 2021 2.91 billion 2020 2.80 billion 2019 2.50 billion 2018 2.32 billion 2017 2.13 billion 2016 1.86 billion 2015 1.59 billion 2014 1.39 billion 2013 1.23 billion 2012 1.06 billion 2011 845 million 2010 608 million -
From Q4 2021 to Q1 2022, Facebook experienced an increase of 33 million monthly active users.
This increase marked a significant rebound following a period of stagnant user growth.
Facebook Statistics FAQ
-
2.95 billion people use Facebook. This figure represents all of Facebook’s monthly active users, indicating that 2.95 billion people log into Facebook monthly (many have accounts but are not active users, which is why they are not counted in social media statistics like these).
In the U.S., there are approximately 243.58 million monthly active Facebook users, representing more than 10% of Facebook’s global user base, while India has the highest number of Facebook users at around 329.65 million.
Meta, Facebook’s parent company, also owns WhatsApp, Instagram, and Messenger, collectively totaling 3.64 billion monthly active users, with almost 80% on Facebook.
-
Is Facebook getting less popular?
No, Facebook is not losing popularity. While younger users increasingly migrate to platforms like Instagram, Snapchat, and TikTok, Facebook maintains a significant user base overall.
The platform gained 33 million monthly active users from Q4 2021 to Q1 2022, indicating continued growth despite facing some challenges.
Although there are controversies regarding data usage and misinformation, Facebook’s rebranding to Meta and its venture into the VR market signal ongoing evolution.
-
What are Facebook’s demographics?
Facebook’s user demographics are predominantly male, with a significant proportion aged 25 to 34. Approximately 43.2% of Facebook users are male, while 31% of users fall within the 25- to 34-year-old age range.
For U.S. users, 77% of women and 61% of men report using Facebook, illustrating a gender difference in usage.
Political affiliation is relatively balanced, with 72% of Democrats and 69% of Republicans using the platform, reflecting the narrowest divide among major social media platforms.
Share of Facebook Users by Age Range
Age Range Share of Facebook Users 13-17 5.9% 18-24 22.6% 25-34 31.6% 35-44 16.9% 45-54 10.5% 55-64 6.4% 65+ 4.9% 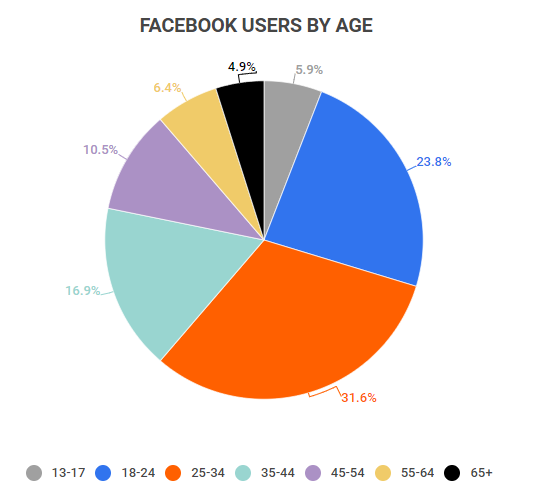
-
Is Facebook the most popular social media platform?
Yes, Facebook is the leading social media platform. As of January 2026, it has 2.95 billion active users, followed by YouTube with 2.51 billion users.
WhatsApp ranks third with about 2 billion users, while Instagram follows closely behind with 2 billion users, both owned by Meta.
Weixin/WeChat rounds out the top five social media platforms with a combined total of 1.30 billion users.
-
Facebook’s estimated worth is about $60 billion. In 2020, the Facebook app generated around $60 billion in revenue, which was a substantial portion of Meta’s $85.9 billion total revenue that year.
In 2021, with the introduction of its VR segment, Meta’s revenue reached $117.9 billion. Even without this segment, Meta’s revenue would have been approximately $115.6 billion, marking a significant increase from previous years.
This growth highlights an exponential rise from Meta’s revenue of just $1.97 billion in 2010.
Conclusion
In 2026, Facebook remains the premier social media platform, boasting over 2.95 billion monthly active users worldwide. The U.S. contributes approximately 243.3 million of these users, while India retains the highest user base of any country.
Facebook’s popularity extends beyond individual users; it is a key player in marketing, with 93% of marketers leveraging Facebook for advertising. Furthermore, 93.7% of businesses have a presence on the platform, with 200 million companies utilizing Facebook’s business tools globally.
References
-
Buffer. “What 777,367,063 Facebook Posts Tell Us About Successful Content in 2019 (New Research).” Accessed on April 29, 2022.
-
Statista. “Distribution of Facebook Users Worldwide as of January 2022, by Age and Gender.” Accessed on April 29, 2022.
-
Statista. “Cumulative Number of Monthly Meta (Formerly Facebook Inc.) Product Users as of 1st Quarter 2022.” Accessed on April 29, 2022.
-
Statista. “Meta’s (Formery Facebook Inc.) Annual Revenue From 2009 to 2021, by Segment.” Accessed on April 29, 2022.
-
Facebook, Inc. “Fourth Quarter 2020 Results Conference Call.” Accessed on April 29, 2022.
-
AdEspresso. “Facebook Ads Cost Benchmarks 2022 (Based on $636 Million Ad Spend).” Accessed on April 29, 2022.
-
Statista. “Leading Social Media Platforms Used by Marketers Worldwide as of January 2021.” Accessed on April 29, 2022.
-
eMarketer. “Amazon’s Share of the U.S. Digital Ad Market Surpassed 10% in 2020.” Accessed on April 29, 2022.
-
Statista. “Number of Active Advertisers on Facebook From 1st Quarter 2016 to 3rd Quarter 2020.” Accessed on April 29, 2022.
-
Kleiner Perkins. “Internet Trends 2018.” Accessed on April 29, 2022.
-
Marketing Charts. “Social Media Marketing Update: Preferred Platforms and Content Types in 2021.” Accessed on April 29, 2022.
-
Pew Research Center. “Online Shopping and Purchasing Preferences.” Accessed on April 29, 2022.
-
Statista. “Share of Facebook’s Mobile Advertising Revenue as of 3rd Quarter 2019.” Accessed on April 29, 2022.
-
The Manifest. “How Social Media Can Help Businesses Win Loyal Customers.” Accessed on April 29, 2022.
-
Pew Research Center. “News Consumption Across Social Media in 2021.” Accessed on April 29, 2022.
-
Statista. “Average Daily Time Spent on Selected Social Networks by Adults in the United States From 2017 to 2022, by Platform.” Accessed on April 29, 2022.
-
Pew Research Center. “Social Media Fact Sheet.” Accessed on April 29, 2022.
-
Pew Research Center. “Partisan Differences in Social Media Use Show Up for Some Platforms, but not Facebook.” Accessed on April 29, 2022.
-
Search Engine Journal. “1.8 Billion People Use Facebook Groups Every Month.” Accessed on April 29, 2022.
-
Statista. “Distribution of Facebook Users Worldwide as of January 2022, by Gender.” Accessed on April 29, 2022.
-
Statista. “Share of Social Media Audiences in the United States Who Use Select Social Networks to Follow Brands and Companies as of 3rd Quarter 2020.” Accessed on April 29, 2022.
-
Hootsuite. “The Global State of Digital 2022.” Accessed on April 29, 2022.
-
Meta. “Extend the Reach of Video Ads Through the Audience Network.” Accessed on April 29, 2022.
-
Digiday. “85 Percent of Facebook Video is Watched Without Sound.” Accessed on April 29, 2022.
-
Socialinsider. “[Facebook Video Study] What 3,977,410 Video Posts Tell Us About Facebook Video Strategy in 2021.” Accessed on April 29, 2022.
-
eMarketer. “TikTok Isn’t the No. 1 U.S. App for Shorter Videos.” Accessed on April 29, 2022.
-
Statista. “Meta (Formerly Facebook Inc.) Revenue and Net Income From 2007 to 2021.” Accessed on April 29, 2022.
-
Statista. “Leading Countries Based on Facebook Audience Size as of January 2026.” Accessed on March 27, 2026.
-
Statista. “Most Popular Social Networks Worldwide as of January 2026, Ranked by Number of Monthly Active Users.” Accessed on March 27, 2026.
-
Business of Apps. “Facebook Revenue and Usage Statistics (2026).” Accessed on March 27, 2026.
-
Statista. “Number of Facebook Users in the United States From 2018 to 2027.” Accessed on March 27, 2026.
Author
Abby is a writer who is passionate about the power of story. Whether it’s communicating complicated topics in a clear way or helping readers connect with another person or place from the comfort of their couch. Abby attended Oral Roberts University in Tulsa, Oklahoma, where she earned a degree in writing with concentrations in journalism and business.