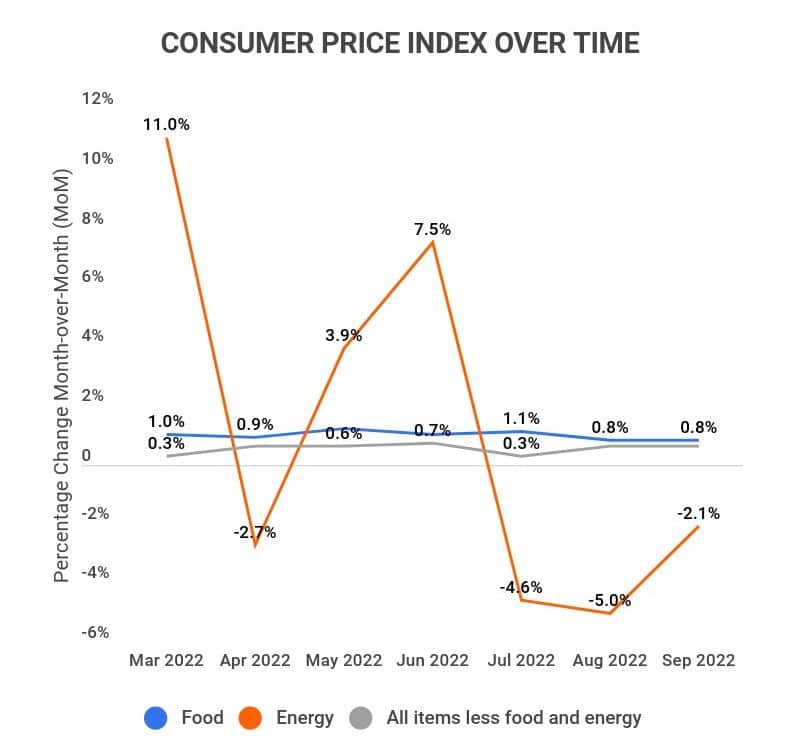
The consumer price index (CPI) rose by 8.2% from September 2022 to September 2023. In September, the CPI increased by 0.4% compared to August, aligning with analyst expectations.
Energy prices have experienced the most significant increase at 19.8%, with all categories rising over 5%. Contributing factors to these surges include ongoing inflationary pressures, geopolitical tensions, climate change, and shifts in consumer behavior. These global events have collectively contributed to rising prices across various sectors.
For a deeper understanding, we have compiled data on the consumer price index for 2023. Our research reveals:
-
The fuel oil index saw the steepest increase in 2023, soaring by 58.1% (although it has been in decline since June).
-
The medical care commodities index had the smallest increase in 2023, at 3.7%.
-
The South experienced the highest consumer price index increase from 2022 to 2023, at 8.7%.
-
The Northeast recorded the lowest consumer price index increase for the same period, at 7.2%.
Consumer Price Index Un-Adjusted 12-Months
| Index | Unadjusted percent change (Sep. 2022-Sep. 2023) |
|---|---|
| Food | 11.2% |
| Energy | 19.8% |
| Commodities less food and energy commodities | 6.6% |
| Services less energy services | 6.7% |
Detailed Consumer Price Index Un-Adjusted 12-Months
| Index | Unadjusted percent change (Sep. 2022-Sep. 2023) |
|---|---|
| Food at home | 13.0% |
| Food away from home | 8.5% |
| Gasoline | 18.2% |
| Fuel oil | 58.1% |
| Electricity | 15.5% |
| Utility (piped) gas service | 33.1% |
| New vehicles | 9.4% |
| Used cars and trucks | 7.2% |
| Apparel | 5.5% |
| Medical care commodities | 3.7% |
| Shelter | 6.6% |
| Transportation services | 14.6% |
| Medical care services | 6.5% |
Consumer Price Index Percent Change By Region
| Region | Unadjusted percent change (Sep. 2022-Sep. 2023) |
|---|---|
| Northeast | 7.2% |
| Midwest | 8.1% |
| South | 8.7% |
| West | 8.3% |
Consumer Price Index Percent Change By City
| Cities | Unadjusted percent change (Sep. 2022-Sep. 2023) |
|---|---|
| Chicago-Naperville-Elgin, IL-IN-WI | 8.7% |
| Los Angeles-Long Beach-Anaheim, CA | 7.8% |
| New York-Newark-Jersey City, NY-NJ-PA | 6.2% |
Consumer Price Index By Relative Importance
| Index | Relative importance ratio |
|---|---|
| Commodities | 39.49 |
| Services | 60.51 |
| Durables | 12.72 |
| Nondurables | 26.77 |
| Housing | 42.24 |
| Education and communication | 6.02 |
| Recreation | 4.99 |
| Food and beverages | 14.50 |
| Apparel less footwear | 1.84 |
| Fuels and utilities | 4.99 |
| Medical care | 8.34 |
| Transportation | 18.77 |
| Utilities and public transportation | 8.48 |
| Household furnishings and operations | 4.77 |
Consumer Price Index FAQ
-
What is the meaning of the Consumer Price Index?
The Consumer Price Index, or CPI, measures the average change over time that urban consumers pay for goods and services. For instance, if the average price of a loaf of bread for an urban consumer was $2.35 in 2022 and increased to $2.50 a year later, this would indicate a 6.38% CPI increase.
-
Is CPI better when it is high or low?
CPI is not inherently better or worse when high or low, but significant fluctuations can signal economic issues. A higher CPI reflects increased inflation, whereas a declining CPI may signal deflation.
Generally, gradual changes in CPI indicate a stable economy, while abrupt shifts may suggest inflationary or deflationary crises.
-
What happens when CPI increases?
An increase in CPI signifies an uptick in average prices over time. This can lead to adjustments in living costs and income, particularly if wages do not keep pace with rising CPI.
For example, if CPI rises by 8.2% and wages remain unchanged, this discrepancy can lead to increased living costs as prices outpace income growth.
-
What causes the consumer price index to increase?
Supply and demand dynamics are crucial in driving CPI increases. A scarcity of raw materials can inflate prices, while abundance can lower them. High demand, especially amid supply shortages, further escalates prices.
For example, in 2022-2023, the cost of fuel oil surged markedly due to supply and demand factors:
-
During the pandemic’s height in 2020, travel demand plummeted, leading to a significant drop in fuel prices.
-
In response, companies reduced oil production to minimize costs.
-
As of 2021, demand rebounded as travel resumed.
-
However, production did not scale back up to pre-pandemic levels.
-
This combination of rising demand and stagnant supply resulted in steep price increases.
-
Conclusion
As of September 2023, the CPI stands at over 296, marking substantial increases over recent years. Prior to the pandemic, CPI typically rose by 1-2% annually. However, in the latest year, CPI surged by 8.2%.
This change reflects a stark contrast from CPI increases of 251.1 to 255.7 (2018-2019) to 271 to 296 (2021-2023), highlighting ongoing inflation challenges.
Ultimately, addressing the detrimental rises in the consumer price index will require tackling various factors, including supply and demand imbalances stemming from both domestic and global events, as well as climate-related challenges.
As it stands, the CPI increase will continue to be a critical indicator of current inflation trends.
References
-
BLS –Consumer Price Index
Author
Jack Flynn is a writer for Zippia. In his professional career he’s written over 100 research papers, articles and blog posts. Some of his most popular published works include his writing about economic terms and research into job classifications. Jack received his BS from Hampshire College.