The median employee tenure in the US is 4.3 years for men and 3.8 years for women. In today’s fast-paced job market, many professionals are aware of the importance of staying in their current position for several years, a notion that resonates strongly with numerous Americans.
Various factors influence the average employee tenure, including age, industry, education level, and gender. Understanding these nuances is vital for both employees and employers as they navigate the evolving labor landscape.
We have compiled recent data on employee tenure in the US. Here are some key insights:
-
Individuals aged 16-19 have an average tenure of 0.7 years, whereas those aged 55+ enjoy an average tenure of 9.8 years.
-
Workers in Management positions exhibit the highest average tenure of 6.2 years, while those in Food preparation and serving have the lowest at 1.6 years.
-
In the Manufacturing sector, employees maintain the highest average tenure of 5.2 years, contrasting with the Leisure and hospitality industry, where the average is just 2.0 years.
-
Staff in the Public Sector have an average tenure of 6.7 years, compared to only 3.8 years for those in the Private Sector.
-
Employees without a diploma average 4.5 years of tenure, while those with a Doctoral degree average 5.5 years.
-
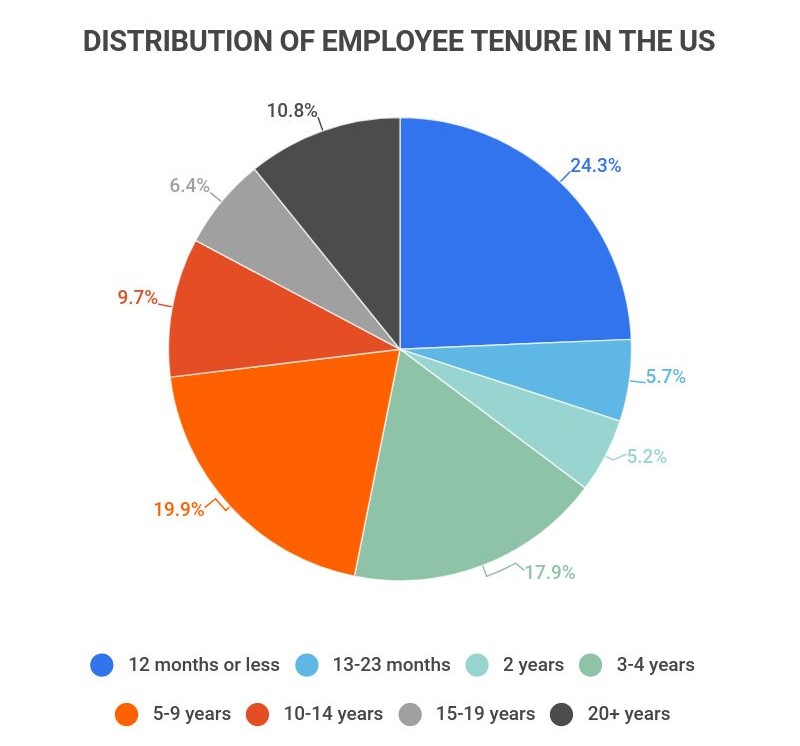
31% of US workers aged 25 and older have over ten years of tenure.
For deeper analysis, we categorized the data as follows:
Age | Occupation | Industry | Sector | Education Level | Percent Of Employees
Median Years Of Employee Tenure By Age
| Age | Average | Men | Women |
|---|---|---|---|
| 16-17 | 0.7 | 0.7 | 0.6 |
| 18-19 | 0.7 | 0.7 | 0.8 |
| 20-24 | 1.2 | 1.3 | 1.1 |
| 25-34 | 2.8 | 2.9 | 2.7 |
| 35-44 | 4.7 | 5.0 | 4.5 |
| 45-54 | 6.9 | 7.5 | 6.3 |
| 55-64 | 9.8 | 10.0 | 9.5 |
| 65+ | 9.9 | 9.7 | 10.0 |
Median Years Of Employee Tenure By Occupation
| Occupation | Median years of tenure |
|---|---|
| Management | 6.2 |
| Business and financial operations | 4.3 |
| Computer and mathematical | 4.2 |
| Architecture and engineering | 5.2 |
| Life, physical, and social science | 4.5 |
| Community and social service | 4.3 |
| Legal | 4.7 |
| Education, training, and library | 5.5 |
| Arts, design, entertainment, sports, and media | 3.5 |
| Healthcare practitioners and technical | 4.6 |
| Healthcare support | 2.9 |
| Protective service | 6.0 |
| Food preparation and serving | 1.6 |
| Building and grounds cleaning and maintenance | 3.6 |
| Personal care and service | 2.7 |
| Sales | 3.4 |
| Office and administrative support | 3.7 |
| Farming, fishing, and forestry | 4.1 |
| Construction and extraction | 3.9 |
| Installation, maintenance, and repair | 4.4 |
| Production | 4.6 |
| Transportation and material moving | 3.1 |
Median Years Of Employee Tenure By Industry
| Industry | Median years of tenure |
|---|---|
| Agriculture and related | 4.7 |
| Mining, quarrying, and oil and gas extraction | 5.2 |
| Construction | 3.9 |
| Manufacturing | 5.2 |
| Wholesale and retail trade | 3.1 |
| Transportation and utilities | 3.7 |
| Information | 4.2 |
| Financial activities | 4.5 |
| Real estate and rental and leasing | 3.9 |
| Professional and business services | 3.4 |
| Education and health services | 4.0 |
| Leisure and hospitality | 2.0 |
Median Years Of Employee Tenure By Sector
| Sector | Median years of tenure |
|---|---|
| Public | 6.8 |
| Private | 3.7 |
Median Years Of Employee Tenure By Education Level
| Education level | Average | Men | Women |
|---|---|---|---|
| No diploma | 4.5 | 4.5 | 4.3 |
| High school diploma | 4.9 | 5.1 | 4.7 |
| Some college | 4.8 | 5.0 | 4.5 |
| Associate degree | 4.9 | 5.2 | 4.6 |
| Bachelor’s degree | 4.9 | 5.0 | 4.7 |
| Master’s degree | 5.2 | 5.1 | 5.3 |
| Doctoral degree | 5.5 | 6.3 | 4.9 |
Percent Of Employees With Over Ten Years Of Tenure By Age
| Age | Average | Men | Women |
|---|---|---|---|
| 25-29 | 1.7% | 2.4% | 1.1% |
| 30-34 | 9.4% | 10.1% | 8.5% |
| 35-39 | 21% | 23.1% | 18.7% |
| 40-44 | 32.4% | 34.3% | 30.4% |
| 45-49 | 39% | 41.8% | 36.1% |
| 50-54 | 46% | 47.3% | 44.5% |
| 55-59 | 50.2% | 52.5% | 47.7% |
| 60-64 | 53.3% | 53.2 | 53.5% |
| 65+ | 52.4% | 51.5% | 53.4% |
Employee Tenure FAQ
-
What is the meaning of employee tenure?
Employee tenure refers to the duration an employee has been with a company. This can be assessed on an individual basis or as an average across all employees within the organization.
For businesses, tracking employee tenure is crucial for insights into turnover rates and employee satisfaction. A lower average tenure compared to industry peers may indicate potential issues with retention.
On a broader scale, median employee tenure statistics offer valuable information regarding the job stability of different demographics in the US.
-
How do you become a tenured employee?
To achieve tenured status, you typically need to remain with a company for several years. While the exact number of years varies by organization, it is generally recognized that employees with less than five years at a job are considered short-tenured, while those with over five years are seen as long-tenured.
-
What are the benefits of employee tenure?
Employee tenure offers numerous advantages, the most significant being organizational stability. Here are some other key benefits associated with long-tenured employees:
-
Job security
-
Lower hiring and training costs
-
Boosted morale and motivation
-
Enhanced productivity
-
Stronger commitment to the organization
-
Conclusion
Employee tenure in the US is influenced by various factors, including age, gender, occupation, industry, and education level. For instance, while the median tenure for public sector employees is approximately 6.7 years, those in the private sector average only about 3.8 years.
In summary, older male employees in the public sector tend to have significantly longer tenures compared to younger female employees in the private sector. While these observations reflect trends rather than definitive conclusions, organizations should strive to create equitable opportunities for long-tenured employment across all demographics.
Source:
-
BLS – Employee Tenure
Author
Jack Flynn is a writer for Zippia. In his professional career he’s written over 100 research papers, articles and blog posts. Some of his most popular published works include his writing about economic terms and research into job classifications. Jack received his BS from Hampshire College.