- Workplace Statistics
- Time Management Statistics
- Employee Wellness Statistics
- Employment Discrimination Statistics
- Employee Recognition Statistics
- Employee Referral Statistics
- Workplace Violence Statistics
- Gamification Statistics
- Employee Feedback Statistics
- Agile Statistics
- Productivity Statistics
- Meeting Statistics
- Cell Phones At Work Statistics
- Social Media At Work Statistics
- Workplace Injury Statistics
- Workplace Stress Statistics
- Leadership Statistics
- Workplace Collaboration Statistics
- Job Satisfaction Statistics
- Paid Holiday Statistics
- Communication In The Workplace Statistics
- Wasting Time At Work Statistics
- 4-day Workweek Statistics
Research Summary. Despite ongoing progress, marginalized groups continue to face discrimination in the workplace through various forms such as harassment and wage disparities. While legal avenues to address workplace discrimination have expanded, challenges remain. Our comprehensive research reveals the following insights:
-
The EEOC reported a total of 67,448 discrimination charges filed in 2021.
-
Only 17.4% of the EEOC’s closed workplace discrimination cases lead to a favorable outcome for the complainant.
-
Claims related to racial discrimination have the lowest success rate, at only 15%.
-
Retaliation remains the most frequently reported discrimination claim, constituting 56% of all submissions.
-
Since 1997, there have been over 1.8 million complaints lodged with the EEOC.
-
Employers paid approximately $484 million in settlements to victims of discrimination in 2021.
For more detailed analysis, we categorized the data as follows:
Type of Discrimination | Worker Experience | Success Rate of Complaints | Region | Trends and Projections | Demographics
Employment Discrimination Statistics By Type of Discrimination
Discrimination can occur for numerous reasons in the workplace. Our research indicates the following trends regarding various types of discrimination:
-
Retaliation is the most common discrimination claim, with 34,332 charges filed in 2021.
Retaliation occurs when employees face adverse actions from employers for engaging in legally protected activities. For example, if an employee participates in a lawful workplace investigation and subsequently faces demotion or termination, this constitutes retaliation. Following retaliation, the second and third most common claims are disability discrimination with 22,843 charges filed and race discrimination with 20,908 charges filed.
U.S. Discrimination Claims by Type 2020-2021
Type Of Discrimination Charge # of Charges Filed (2021) # of Charges Filed (2020) % of All Charges Filed (2021) % of All Charges Filed (2020) Retaliation 34,332 37,632 56.0% 55.8% Disability 22,843 24,324 37.2% 36.1% Race 20,908 22,064 34.1% 32.7% Sex 18,762 21,398 30.6% 31.7% Age 12,965 14,183 21.1% 21.0% National Origin 6,213 6,377 10.1% 9.5% Color 3,516 3,562 5.7% 5.3% Religion 2,111 2,404 3.4% 3.6% Equal Pay Act 885 980 1.4% 1.5% Genetic Information 242 440 0.4% 0.7% -
Genetic information claims are the least common, with only 242 charges filed in 2021.
This type of discrimination occurs when employees are treated unfairly due to genetic predispositions to certain health conditions, often stemming from employers’ reluctance to manage health insurance risks. The second and third least common claims are equal pay act claims (885 charges filed) and religion claims (2,111 charges filed).
-
Discrimination based on retaliation, disability, race, or sex accounts for over 30% of all charges.
Retaliation makes up 56% of all claims, followed by disability (37.2%), race (34.1%), and sex (30.6%).
-
Equal pay discrimination accounts for only 1.4% of filed charges.
This low percentage may be attributed to employers’ lack of transparency regarding salary discussions among employees.
Employment Discrimination Statistics By Worker Experience
Many employees witness workplace discrimination, yet a significant number do not report it, which can harm the affected employee and the overall workplace culture. Here are the key statistics:
-
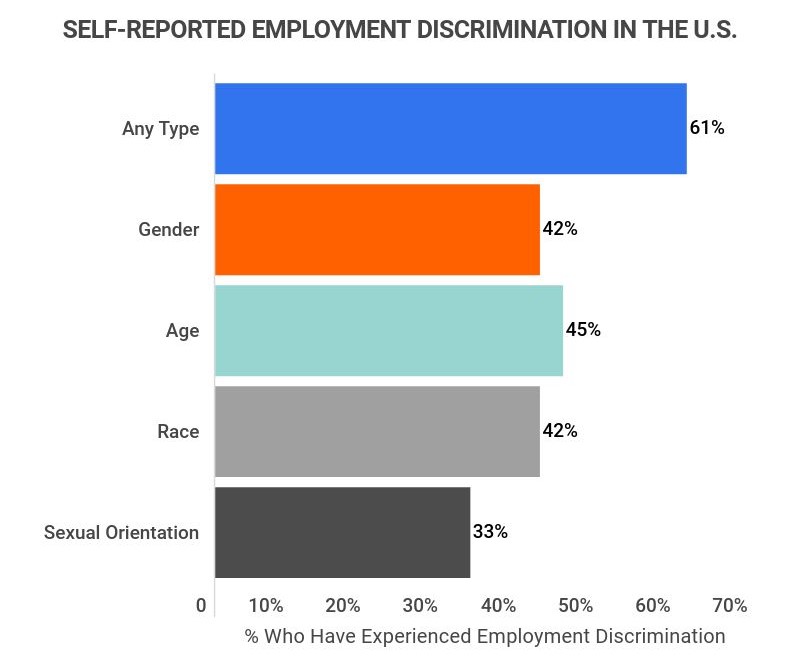
In the United States, 61% of employees have experienced or witnessed workplace discrimination.
This statistic is notably higher than in several other countries, such as France (43%) and Germany (37%).
-
45% of Americans have experienced age discrimination, making it the most prevalent form of discrimination in the U.S.
Generally, younger employees may face discrimination from older, more experienced colleagues, while older employees encounter biases against their age. Additionally, 42% of Americans report experiencing discrimination based on race or gender.
-
33% of Americans have experienced discrimination based on their sexual orientation.
While lower than age, sex, or race discrimination, it’s important to note that only about 7% of Americans identify as LGBTQ+, suggesting that the number of individuals facing discrimination based on sexual orientation may be alarmingly high.
Employment Discrimination Statistics By Success Rate of Complaints
Unfortunately, the success rates for discrimination complaints in the U.S. remain low. Many complaints are resolved outside of court, and numerous cases never become formal charges. According to our findings:
-
Only 17.4% of the EEOC’s closed workplace discrimination charges lead to a resolution for clients.
Considering that only 15% of complaints progress to formal lawsuits, the proportion of individuals achieving justice is concerningly low. However, it’s worth noting that 2020 showed improvement compared to 2019, when only 15.6% of cases resulted in resolutions.
-
The average workplace discrimination settlement is approximately $40,000.
This amount can vary significantly based on the employer’s size. For instance, the court may award up to $50,000 for employers with 15 to 100 employees, $100,000 for those with 101 to 200 employees, $200,000 for 201 to 500 employees, and as much as $300,000 for employers with over 500 employees.
-
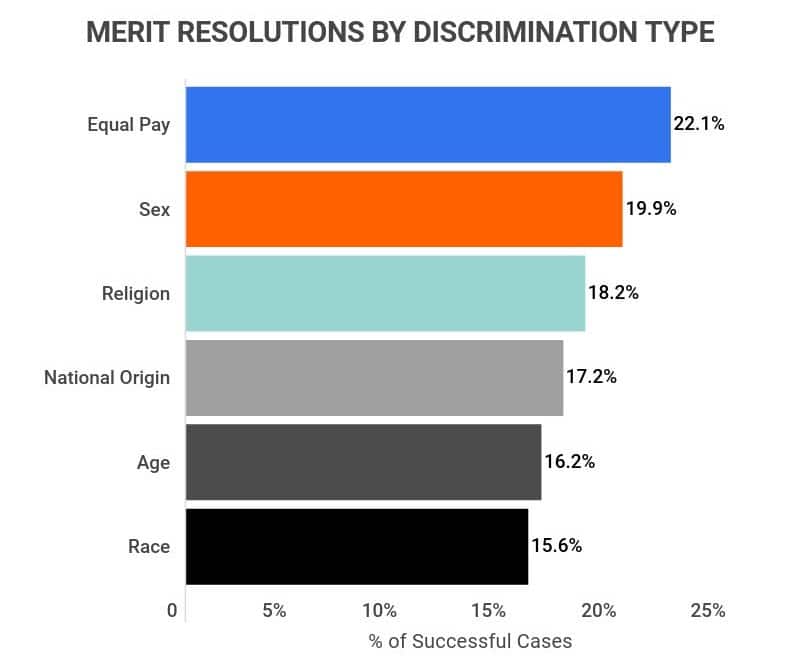
22.1% of equal pay charges that lead to a resolution represent the highest success rate among discrimination cases.
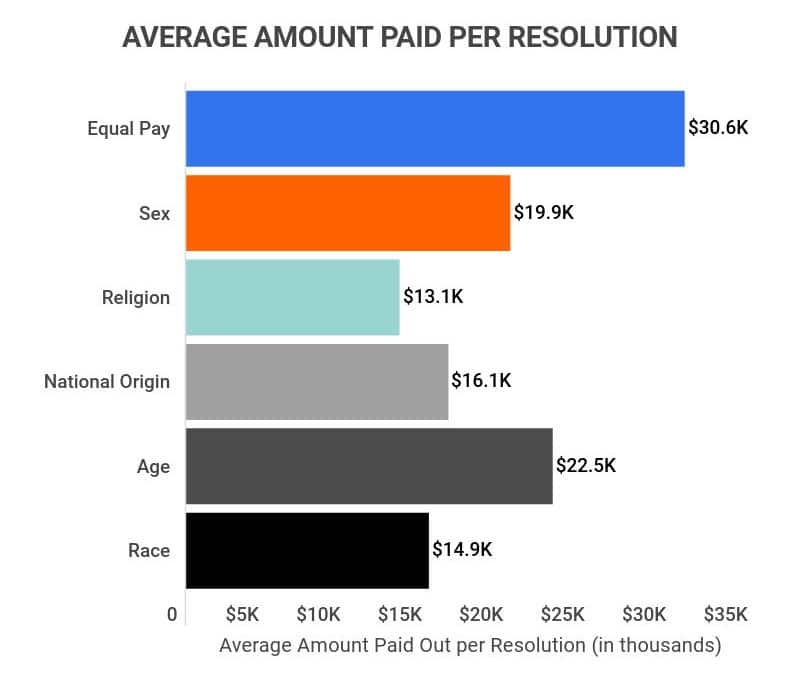
With an average payout of $30,600, equal pay claims outperform other discrimination cases in terms of success rate. The next highest is sex discrimination, with a resolution rate of 19.9% and a lower average payout of $19,900.
-
Sex discrimination claims have had the highest number of resolutions since 1997, totaling 123,665.
Though payouts for these claims are generally lower than those for equal pay, sex-related claims are far more prevalent. Race discrimination claims also have many resolutions, totaling 118,870.
-
Religious discrimination claims have the lowest average payout, at only $13,100.
This figure is 43% less than the average payout for equal pay claims. Other low-payout categories include race discrimination ($14,900) and national origin ($16,100).
-
The EEOC resolved 165 merit lawsuits and filed 93 discrimination allegations in 2020.
Although this resulted in $106 million secured for victims, it represents only a fraction of the claims the EEOC handles. For instance, the agency received over 470,000 calls related to discrimination through its toll-free number.
Employment Discrimination Statistics By Region
The vastness of the U.S. means that discrimination rates vary by region. Historical contexts in certain areas can exacerbate specific forms of discrimination. Here are some regional insights:
-
Alabama has the highest rate of discrimination in the U.S., with 62.2 complaints per 100,000 people.
High rates of discrimination are also reported in Mississippi (60.8), Arkansas (51.7), and Georgia (50.3), indicating a regional pattern of discrimination.
Discrimination Cases per Capita by State
State # Of Complaints Per 100,000 People Alabama 62 Mississippi 60 Arkansas 51 Georgia 50 New Mexico 48 Tennessee 44 North Carolina 42 Indiana 41 Illinois 39 Louisiana 39 Maryland 38 Nevada 38 Virginia 35 Florida 34 Oklahoma 34 Arizona 34 Pennsylvania 33 Colorado 33 Missouri 33 Texas 31 Michigan 25 Kansas 25 Ohio 24 South Carolina 24 Hawaii 22 Kentucky 21 New York 19 New Jersey 18 Minnesota 17 Wisconsin 17 Delaware 17 Washington 16 California 16 Alaska 12 Wyoming 9 North Dakota 8 West Virginia 7 Utah 7 Connecticut 7 South Dakota 6 Massachusetts 6 Oregon 5 Iowa 5 Rhode Island 5 Vermont 5 Nebraska 4 Idaho 4 New Hampshire 4 Montana 2 Maine 2 -
Maine has the lowest rate of discrimination in the U.S., with 2.5 complaints per 100,000 people.
This represents a staggering 25 times fewer complaints than Alabama. Other states with low discrimination rates include Montana (2.6), New Hampshire (4.0), Idaho (4.3), and Nebraska (4.3), often characterized by lower population densities.
-
New Mexico has the highest incidence of national origin-related complaints, at 5 per 100,000 people.
Despite this high number, national origin discrimination in New Mexico has decreased by 68.9% from 2009 to 2018, while Colorado and Florida follow with 3.1 complaints per 100,000 people.
-
From 2009 to 2018, equal pay discrimination cases in Michigan surged by 163.6%.
Maryland saw a 123.1% increase during the same period, while New Mexico experienced a significant decrease, halving its cases.
-
From 2009 to 2018, sex discrimination cases in Nebraska rose by 166.7%.
Massachusetts also saw a notable increase of 108.7%, while Idaho had the highest reduction at -55.9%.
-
A total of 48 states have enacted equal pay laws.
Only North Carolina, South Carolina, Utah, and Wisconsin lack specific equal pay legislation, although general employment laws against discriminatory wages are in place.
-
Thirty-three states provide legal protections for LGBTQ+ workers.
Conversely, 17 states still lack such protections, predominantly located in the South and Midwest.
-
Michigan is the sole state prohibiting weight discrimination.
Despite a 27.5% increase in obesity rates among adults, the remaining 49 states offer no protections for overweight workers.
Employment Discrimination Statistics By Trends and Projections
Although discrimination complaints in the U.S. have shown a declining trend, there is still significant work to be done. Here are some notable trends and projections regarding employment discrimination:
-
The EEOC recorded 67,448 discrimination charges in 2020.
Overall, there has been a gradual decline in the number of discrimination charges filed, dropping from 72,675 in 2019 and 76,418 in 2018, averaging a decrease of 3,000-5,000 charges annually.
-
Since 1997, over 1.8 million complaints have been filed with the EEOC.
Among these complaints, 35.7% were related to race discrimination (710,512), 28.7% to sex discrimination (570,360), and 21.3% to age discrimination (422,866), with the remaining cases encompassing national origin (198,689), religion (64,006), and equal pay (22,861) discrimination.
-
Discrimination charges are experiencing a year-over-year decrease of 5-8%.
From 2018 to 2019, employment discrimination charges decreased by 5.1%, with a further drop of 7.75% from 2019 to 2020. These trends may indicate progress toward a more equitable workplace.
-
From 2019 to 2020, discrimination charges related to genetic information increased by 133.3%.
Despite making up only 0.7% of all discrimination charges in 2020, this represents a significant rise from 0.3% in 2019.
-
From 1997 to 2020, retaliation-related discrimination charges increased by 146.9%.
Currently, retaliation accounts for 56% of all charges, a substantial rise from just 22.6% in 1997.
-
From 1997 to 2020, race discrimination charges have decreased by 9.7%.
This decline in race discrimination rates is noteworthy, dropping from 36.2% of charges in 1997 to 32.7% in 2020.
Employment Discrimination Statistics By Demographics
Discrimination in the workplace can affect individuals for various reasons. Here are key statistics regarding the demographics of discrimination:
-
24% of Black and Hispanic employees report experiencing discrimination within the past year.
In contrast, only 15% of White employees report similar experiences. Overall, 18% of all workers indicate they have faced discrimination in the past year, with Black and Hispanic employees significantly surpassing the national average.
-
Of that 24%, 75% of Black employees report being discriminated against due to their race.
For Hispanic employees, this figure is also high at 61%, compared to only 42% of White employees who report the same. Overall, 52% of the 18% of workers who report discrimination attribute it to their race.
-
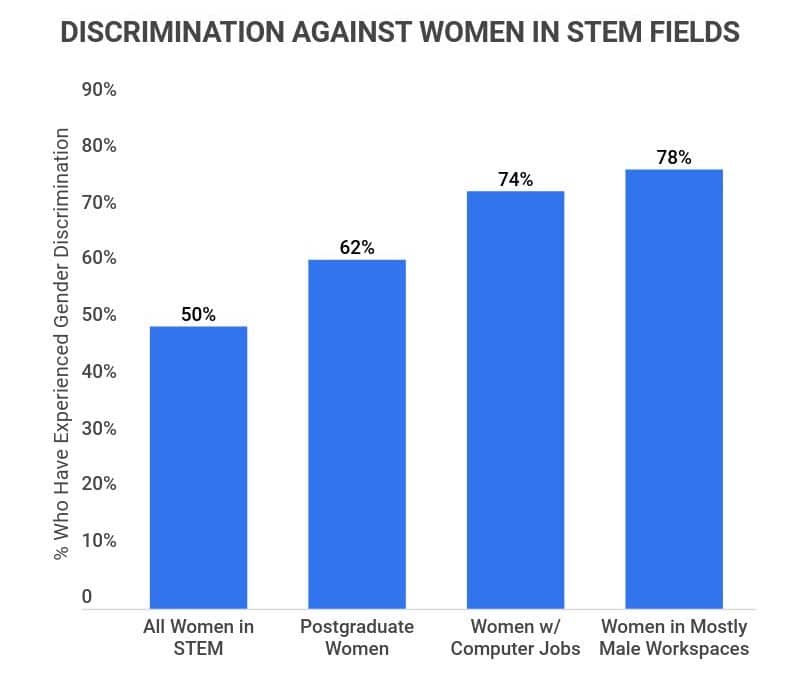
50% of women in STEM fields report experiencing gender discrimination.
STEM occupations constitute 48% of U.S. jobs, but only 27% of these positions are held by women. Notably, women with advanced degrees in STEM fields report even higher rates of discrimination, with 62% experiencing unfair treatment.
-
Individuals aged 18-34 are the most likely to encounter workplace discrimination, with 52% reporting such experiences.
Older employees also experience discrimination, with 33% of those aged 55 and over reporting age-related discrimination.
Employment Discrimination Statistics FAQ
-
How many workplace discrimination cases were there in 2021?
The EEOC filed 114 workplace discrimination cases in 2021. This marks a 23.5% decrease from 2019 when 149 cases were filed.
It’s essential to understand that these cases represent only a fraction of the total discrimination charges filed. In 2020, the EEOC reported 67,448 discrimination charges.
-
What is the most common basis of employment discrimination?
Retaliation is the most prevalent basis for employment discrimination. As of 2021, retaliation accounted for approximately 56% of all discrimination charges. This represents a 146.9% increase from 1997, when it comprised 22.6% of all claims.
Other significant types of discrimination that account for over 30% of charges include disability (36.1%), race (32.7%), and sex (31.7%).
-
Who experiences workplace discrimination the most?
Minorities are disproportionately affected by workplace discrimination. Workers who differ in gender, race, or other characteristics from the majority of their colleagues are more prone to facing discrimination.
For instance, one-fourth of Black workers, who represent only 12.6% of the workforce, report experiencing employment discrimination in the past year. Among these, 75% attribute it to their race.
This pattern is also evident among female employees in STEM fields, where only 27% of workers are women, leading to significantly higher discrimination rates. In fact, 50% of women and 62% of women with postgraduate qualifications in STEM report gender-related discrimination.
-
What is the average EEOC settlement?
The average EEOC settlement is around $40,000. However, this can vary widely based on employer size.
For example, the court may award up to $50,000 for employers with between 15 and 100 employees, $100,000 for those with 101 to 200 employees, $200,000 for employers with 201 to 500 employees, and up to $300,000 for employers with over 500 employees.
-
What are the chances of winning an EEOC case?
95% of EEOC district court cases are successful, though this figure can be misleading. In reality, only 17.4% of the EEOC’s closed workplace discrimination charges result in a resolution for clients, as merely 2% of charges lead to formal action.
-
How can one prove discrimination in the workplace?
The most effective way to prove workplace discrimination is through direct evidence. This may include statements, written documents, or emails that can be substantiated in court.
Unfortunately, most employment discrimination cases rely on circumstantial evidence, requiring victims to establish they were discriminated against through inferences.
For example, if an employee believes they were terminated due to their gender, they must demonstrate the employer’s intent through inferences, such as “the company frequently replaces female employees with males.”
Such evidence can be challenging to prove, making it easy for employers to contest, which is why discrimination cases rarely proceed to court.
Conclusion
In recent decades, the issue of workplace discrimination has gained significant attention, leading to the establishment of federal and state legislation. Since 1997, over 1.8 million discrimination charges have been filed, and encouragingly, the annual numbers appear to be declining.
Nonetheless, discrimination continues to pose a substantial challenge for various demographics across diverse regions. Women, people of color, LGBTQ+ individuals, and workers of different ages still find their earnings, job security, and dignity jeopardized by discriminatory practices.
It is hoped that current trends of heightened awareness and decreasing case numbers will persist, paving the way for an equitable work environment for all.
References
-
JDSUPRA. “EEOC FY 2020 Statistics: EEOC’s Recovery on Behalf of Employees Dramatically Increased, Number of Discrimination Charges at All-Time Low.” Accessed March 20, 2022.
-
Outsolve. “EEOC Announces Record Year: Secures $484M for Victims of Discrimination.” Accessed March 20, 2022.
-
EEOC. “EEOC Releases Fiscal Year 2020 Enforcement and Litigation Data.” Accessed March 20, 2022.
-
Statista. “How Common Is Workplace Discrimination?” Accessed March 20, 2022.
-
Smithey Law Group. “What Is the Average Settlement for a Discrimination Lawsuit?” Accessed March 20, 2022.
-
Paychex. “Employment and Discrimination: Exploring the Climate of Workplace Discrimination from 1997 to 2018.” Accessed March 20, 2022.
-
CNBC. “Studies show weight discrimination permeates the US workplace — but it’s legal in 49 states.” Accessed March 21, 2022.
-
EEOC. “Charge Statistics (Charges filed with EEOC) FY 1997 Through FY 2020.” Accessed March 21, 2022.
-
Pew Research Center. “Women and Men in STEM Often at Odds Over Workplace Equity.” Accessed March 21, 2022.
-
Glassdoor. “Glassdoor Survey Finds Three in Five U.S. Employees Have Experienced or Witnessed Discrimination Based on Age, Race, Gender or LGBTQ Identity at Work.” Accessed March 21, 2022.
- Workplace Statistics
- Time Management Statistics
- Employee Wellness Statistics
- Employment Discrimination Statistics
- Employee Recognition Statistics
- Employee Referral Statistics
- Workplace Violence Statistics
- Gamification Statistics
- Employee Feedback Statistics
- Agile Statistics
- Productivity Statistics
- Meeting Statistics
- Cell Phones At Work Statistics
- Social Media At Work Statistics
- Workplace Injury Statistics
- Workplace Stress Statistics
- Leadership Statistics
- Workplace Collaboration Statistics
- Job Satisfaction Statistics
- Paid Holiday Statistics
- Communication In The Workplace Statistics
- Wasting Time At Work Statistics
- 4-day Workweek Statistics
Author
Jack Flynn is a writer for Zippia. In his professional career he’s written over 100 research papers, articles and blog posts. Some of his most popular published works include his writing about economic terms and research into job classifications. Jack received his BS from Hampshire College.