Find a Job You Really Want In
Hardest Working Countries 2026
In today’s global economy, the concept of hard work remains a significant ideal, yet the United States does not hold the title of the hardest working country in the world. As of 2026, the average American worker clocks in at approximately 1,791 hours per year, which positions the U.S. as the tenth highest in terms of annual working hours among developed nations.
This discrepancy highlights the complex interplay of workplace regulations, cultural values, and economic conditions that influence how much individuals work in different countries. Notably, a correlation does not always exist between a nation’s wealth or productivity and the total hours its workforce dedicates to their jobs.
For instance, Germany, despite having the least annual working hours among developed countries, boasts a robust economy with a per capita GDP significantly higher than that of Mexico, where workers log 58% more hours annually. This showcases that hard work does not always equate to higher economic output.
Here’s a look at the top 10 hardest working countries in the world as of 2026:
-
Mexico
Average hours of work annually: 2,127.8 hours
Percentage of population that works 50+ hours per week: 27%
Mexico continues to lead with the highest average annual work hours, where a significant portion of the workforce exceeds 50 hours weekly. This contributes to Mexico’s ranking as one of the countries with the least leisure time among developed nations.
-
Costa Rica
Average hours of work annually: 2,073.3 hours
Percentage of population that works 50+ hours per week: 25.6%
Costa Rica’s workforce is dedicated, although the percentage of workers putting in over 50 hours has been declining over the years.
-
Chile
Average hours of work annually: 1,915.6 hours
Percentage of population that works 50+ hours per week: 7.7%
Chilean workers contribute to a high average of annual hours, reflecting a reasonable commitment to work.
-
South Korea
Average hours of work annually: 1,915 hours
Percentage of population that works 50+ hours per week: 19.7%
In South Korea, a strong work ethic is evident, as nearly one in five adults work over 50 hours a week, and the country continues to face challenges related to employee rights, including the lack of mandated paid sick leave.
-
Malta
Average hours of work annually: 1,882.2 hours
Percentage of population that works 50+ hours per week: N/A
Malta’s workers maintain a high average of hours worked, solidifying its place among the hardest working nations.
-
Greece
Average hours of work annually: 1,872.2 hours
Percentage of population that works 50+ hours per week: 4.5%
Though Greece has a lower percentage of workers logging over 50 hours, its overall work hours remain consistently high.
-
Romania
Average hours of work annually: 1,838.4 hours
Percentage of population that works 50+ hours per week: N/A
Romania has seen a gradual increase in working hours, reflecting a growing workforce commitment.
-
Croatia
Average hours of work annually: 1,835 hours
Percentage of population that works 50+ hours per week: N/A
Croatia’s average working hours remain stable, keeping it within the ranks of highly active workforces.
-
Poland
Average hours of work annually: 1,830.2 hours
Percentage of population that works 50+ hours per week: 4.2%
Poland exhibits the lowest percentage of workers exceeding 50 hours while still maintaining a notable average of annual work hours.
-
United States
Average hours of work annually: 1,791 hours
Percentage of population that works 50+ hours per week: 10.4%
Despite the cultural emphasis on hard work, the U.S. ranks tenth in the world for annual hours worked.
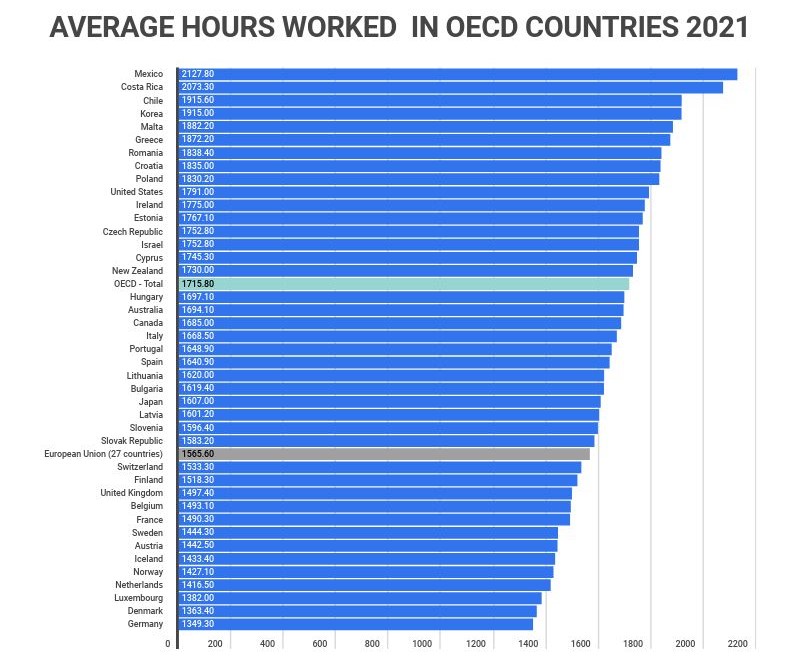
Average Annual Work Hours in OECD Countries
| Location | 2021 | 2020 | 2019 | 2018 | 2017 |
|---|---|---|---|---|---|
| Mexico | 2,127 | 2,123 | 2,138 | 2,149 | 2,148 |
| Costa Rica | 2,073 | 1,913 | 2,059 | 2,121 | 2,178 |
| Chile | 1,915 | 1,825 | 1,929 | 1,955 | 1,963 |
| Korea | 1,915 | 1,908 | 1,967 | 1,993 | 2,018 |
| Malta | 1,882 | 1,902 | 2,062 | 1,972 | 1,942 |
| Greece | 1,872 | 1,730 | 1,916 | 1,961 | 1,946 |
| Romania | 1,838 | 1,806 | 1,803 | 1,787 | 1,785 |
| Croatia | 1,835 | 1,833 | 1,837 | 1,811 | 1,823 |
| Poland | 1,830 | 1,768 | 1,782 | 1,787 | 1,811 |
| United States | 1,791 | 1,767 | 1,777 | 1,781 | 1,777 |
| Ireland | 1,775 | 1,746 | 1,771 | 1,782 | 1,775 |
| Estonia | 1,767 | 1,637 | 1,694 | 1,707 | 1,768 |
| Czech Republic | 1,752 | 1,703 | 1,786 | 1,784 | 1,776 |
| Israel | 1,752 | 1,782 | 1,898 | 1,910 | 1,918 |
| Cyprus | 1,745 | 1,701 | 1,809 | 1,809 | 1,821 |
| New Zealand | 1,730 | 1,739 | 1,783 | 1,759 | 1,756 |
| OECD – Total | 1,715 | 1,668 | 1,741 | 1,752 | 1,757 |
| Hungary | 1,697 | 1,657 | 1,722 | 1,729 | 1,747 |
| Australia | 1,694 | 1,683 | 1,722 | 1,732 | 1,738 |
| Canada | 1,685 | 1,644 | 1,690 | 1,708 | 1,695 |
| Italy | 1,668 | 1,553 | 1,710 | 1,719 | 1,719 |
| Portugal | 1,648 | 1,611 | 1,743 | 1,737 | 1,727 |
| Spain | 1,640 | 1,569 | 1,682 | 1,697 | 1,692 |
| Lithuania | 1,620 | 1,594 | 1,665 | 1,664 | 1,656 |
| Bulgaria | 1,619 | 1,604 | 1,645 | 1,644 | 1,643 |
| Japan | 1,607 | 1,598 | 1,643 | 1,680 | 1,708 |
| Latvia | 1,601 | 1,576 | 1,631 | 1,661 | 1,649 |
| Slovenia | 1,596 | 1,533 | 1,601 | 1,599 | 1,621 |
| Slovak Republic | 1,583 | 1,572 | 1,692 | 1,703 | 1,713 |
| European Union (27 countries) | 1,565 | 1,511 | 1,593 | 1,597 | 1,599 |
| Switzerland | 1,533 | 1,498 | 1,549 | 1,551 | 1,559 |
| Finland | 1,518 | 1,528 | 1,538 | 1,546 | 1,548 |
| United Kingdom | 1,497 | 1,363 | 1,537 | 1,536 | 1,535 |
| Belgium | 1,493 | 1,443 | 1,577 | 1,580 | 1,578 |
| France | 1,490 | 1,407 | 1,518 | 1,514 | 1,507 |
| Sweden | 1,444 | 1,426 | 1,453 | 1,466 | 1,466 |
| Austria | 1,442 | 1,400 | 1,508 | 1,502 | 1,498 |
| Iceland | 1,433 | 1,446 | 1,480 | 1,496 | 1,507 |
| Norway | 1,427 | 1,410 | 1,418 | 1,419 | 1,419 |
| Netherlands | 1,416 | 1,406 | 1,438 | 1,436 | 1,436 |
| Luxembourg | 1,382 | 1,420 | 1,507 | 1,509 | 1,508 |
| Denmark | 1,363 | 1,342 | 1,371 | 1,381 | 1,404 |
| Germany | 1,349 | 1,324 | 1,381 | 1,384 | 1,389 |
What Country Has the Hardest Workers?
Mexico boasts the world’s hardest working individuals, averaging 2,127.8 hours annually. This translates to about 40.9 hours per week, which is roughly 5.7% more than the average work hours of Americans.
Moreover, 27% of Mexican workers consistently exceed 50 hours of work weekly, ranking among the highest globally.
References
Hours worked – OECD
Work-Life Balance – OECD
Author
Matthew Zane is the lead editor of Zippia's How To Get A Job Guides. He is a teacher, writer, and world-traveler that wants to help people at every stage of the career life cycle. He completed his masters in American Literature from Trinity College Dublin and BA in English from the University of Connecticut.