- HR Statistics
- Average Labor Cost Percent Of Sales
- Average Time to Reach Profitability At A Startup
- Office Space Per Employee
- Recruitment Statistics
- Employee Engagement Statistics
- Work-Life Balance Statistics
- BYOD Statistics
- Paternity Leave Statistics
- Onboarding Statistics
- Average Paid Maternity Leave In Us
- Average Cost Of A Bad Hire
- Employee Theft Statistics
- Paid Family Leave Statistics
- Cost Of Hiring Statistics
- Employee Turnover Statistics
- Average Cost Of Employer Sponsored Health Insurance Statistics
- Sexual Harassment In The Workplace Statistics
- HR Statistics
- PTO Statistics
- Social Media Recruitment Statistics
- Hiring Statistics
- Out Of Prison Employment Statistics
20+ Essential Hiring Statistics [2026]: Everything You Need to Know About Hiring
Research Summary: Navigating the hiring process is a common experience for many, with some finding it straightforward while others face weeks of interviews and uncertainty. Regardless of the experience, understanding the intricacies of the hiring process is essential for both job seekers and employers.
We’ve compiled key insights into the current state of hiring in the US, revealing critical statistics that shape today’s employment landscape:
-
37% of US workers are passive candidates who are open to new opportunities but not actively job hunting.
-
78% of companies report that Applicant Tracking Systems (ATS) streamline the hiring process.
-
60% of job seekers abandon their applications midway.
-
Prior experience is the top priority for recruiters, with 82% affirming its significance.
-
It now takes an average of 42 days to fill a job vacancy.
For a deeper dive into the data, we’ve categorized our findings as follows:
Job Seeker | Hiring Priority | Job Offer Rejection | Job Level | Recruitment Struggle | Trends and Projections
Job Seeker Statistics
Understanding how job seekers navigate the hiring landscape is crucial for both candidates and recruiters. Here are some revealing statistics:
-
50% of all applications originate from job board platforms.
Job boards dominate the application landscape, with 35% of applications coming from internal company career sites.
-
75% of job changers utilize LinkedIn to guide their career choices.
LinkedIn-influenced hires are twice as likely to attract employer interest, with the platform facilitating valuable networking opportunities.
-
The average job seeker dedicates 20-25 hours weekly to job hunting.
This time commitment varies based on individual circumstances; for instance, students or full-time workers might invest only 10-15 hours, while those unemployed may spend upwards of 40 hours weekly.
-
61% of new hires report that their job differs from initial expectations.
This discrepancy is more pronounced among male hires, 65% of whom express this sentiment, compared to 56% of female hires.
-
37% of job seekers will move on to another listing if they can’t find online information about a company.
Researching a company’s online presence is a critical step for candidates to avoid potential job scams.
Hiring Priority Statistics
Effective hiring requires clear priorities from recruiters. Here’s what we found regarding their top concerns:
-
Building a talent pipeline is the leading priority for 43% of recruiters.
Following closely, 29% of recruiters prioritize candidate experience and time to hire.
-
The talent pool expands tenfold when leveraging employee networks.
Utilizing platforms like LinkedIn and fostering employee referrals enhances candidate sourcing.
-
69% of executives regard diversity and inclusion as crucial.
Companies focusing on diversity not only enhance their workforce but also realize higher profits, with 43% of such companies reporting increased financial performance.
Hiring Priorities For Recruiters
Priority Share of recruiters who say it’s #1 Building a talent pipeline 43% Candidate experience 29% Time to hire 29%
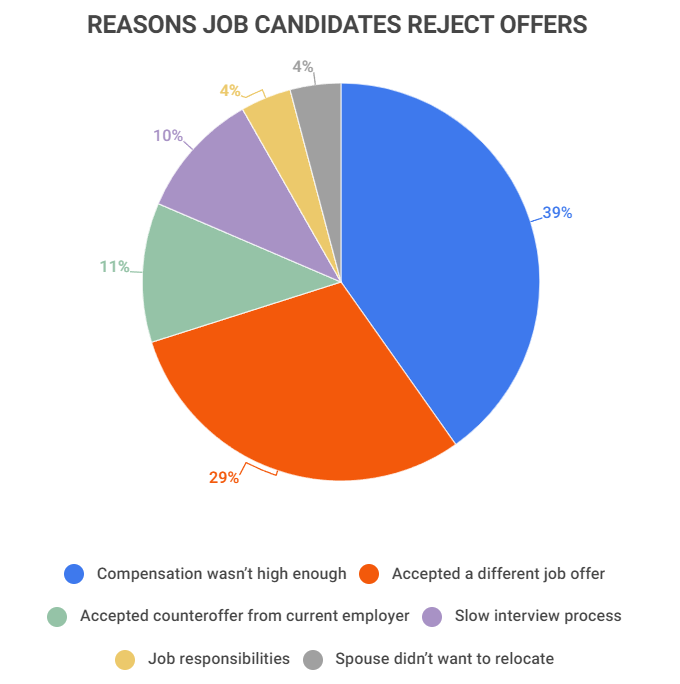
Job Offer Rejection Statistics
Securing a candidate through the hiring process doesn’t guarantee acceptance of a job offer. Here are key reasons why candidates decline:
-
39% of candidates reject job offers due to inadequate compensation.
This is the primary reason for rejection, alongside candidates selecting alternative offers or experiencing prolonged employer response times.
-
89% of employers believe their staff leave for better pay.
This assumption often leads to counter-offers aimed at retaining employees.
Reasons Why Candidates Reject Job Offers
Reason for rejection Share of candidates Compensation wasn’t high enough 39% Accepted a different job offer 29% Accepted counteroffer from current employer 11% Slow interview process 10% Job responsibilities 4% Spouse didn’t want to relocate 4%
Hiring Statistics by Job Level
Job seekers of all experience levels face challenges in the job market. Our data highlights the following:
-
87% of recruiters believe a four-year degree enhances competitiveness for entry-level positions.
While a degree can ease entry into the job market, the financial return on this investment varies by industry.
-
41% of companies find entry-level jobs the most challenging to fill.
This is particularly relevant given the emphasis on educational qualifications for these roles.
Recruitment Struggle Statistics
Employers also face significant challenges in finding ideal candidates. Here’s what our research uncovered:
-
90% of employers report difficulty in sourcing skilled candidates.
In the post-pandemic job market, numerous vacancies exist, but qualified candidates are selective, often opting for the most attractive offers.
-
76% of recruiters cite attracting qualified candidates as their biggest challenge.
Many job seekers remain passive, complicating recruiters’ efforts to engage top talent.
-
The average cost of a bad hire is $14,900.
This figure can escalate to as much as $240,000, depending on the role. Overall, a poor hiring decision typically costs about 30% of the employee’s first-year salary.
-
On average, 250 resumes are submitted per job posting.
This volume can lead employers to spend only 6-7 seconds reviewing each resume.
Hiring Trends and Projections
The job market continues to evolve, influenced by recent trends and shifting priorities. Here’s what to expect:
-
77% of talent professionals agree that diversity is essential for future recruitment.
As of 2026, a significant 80% of talent professionals have identified “diversity hiring” as a critical trend, shaping the candidate selection process.
-
Only 16% of HR professionals feel equipped to handle virtual recruiting.
Despite the rise of virtual recruitment, many HR professionals require further training to adapt effectively to online hiring processes.
Hiring Statistics FAQ
-
What is the average time to hire?
The average time to hire in the US is 24 days. This includes approximately seven days for posting the job, ten days for screening and interviewing candidates, and another five days for offer acceptance.
Delays due to poor management or a high volume of applications can prolong this timeframe, potentially causing candidates to lose interest.
-
What percentage of applicants are hired?
Only 11% of applicants are hired. This statistic highlights the competitive nature of the job market, with up to 250 applications submitted per job listing.
-
How much does it cost to hire someone?
It costs an average of $4,000 to hire someone. This figure underscores the importance of making informed hiring decisions, as the cost of a bad hire can be significantly higher.
On average, the cost of a bad hire is $14,900, but it can escalate to $240,000 depending on the role, equating to about 30% of the employee’s first-year earnings.
-
What is the top source of new hires?
Employee referrals remain the top source of new hires. Referrals account for around 30% of all hires and 45% of internal hires.
This reinforces the significance of networking and platforms like LinkedIn in job searching, where personal connections can expedite the hiring process.
Conclusion
Whether you’re an employer or a candidate, understanding the hiring process can alleviate stress and foster success. Key factors such as prior experience, compensation, and response times are pivotal in shaping outcomes.
With 89% of employers believing employees leave primarily for higher pay and 82% of recruiters valuing experience, it’s clear that awareness of these statistics can inform better decisions. By staying updated on current market trends, average salaries, and benefits, both job seekers and employers can position themselves advantageously in the job market.
References
-
Resources for Employers. “INFOGRAPHIC: 37% of US workers are passive candidates. Who are they?” Accessed on August 22nd, 2022.
-
SHRM. “Study: Most Job Seekers Abandon Online Job Applications.” Accessed on August 22nd, 2022.
-
CivicPlus. “5 Ways to Leverage LinkedIn for More Than Job Ads in Talent Management.” Accessed on August 22nd, 2022.
-
IMDiversity. “How Much Time Should you Spend on Your Job Search?” Accessed on August 22nd, 2022.
-
Hyreo. “Top hiring priorities for recruiters.” Accessed on August 22nd, 2022.
-
LinkedIn. “The Ultimate List of Hiring Statistics.” Accessed on August 22nd, 2022.
-
Job Monkey. “Why Do Job Candidates Turn Down Job Offers?” Accessed on August 22nd, 2022.
-
Forbes. “To Attract The Best, First Understand Why They Leave.” Accessed on August 22nd, 2022.
-
ABC. “Small businesses still struggle to find enough workers.” Accessed on August 22nd, 2022.
-
Business News Daily. “How Much Is That Bad Hire Really Costing Your Business?” Accessed on August 22nd, 2022.
-
ERE. “Why You Can’t Get A Job … Recruiting Explained By the Numbers.” Accessed on August 22nd, 2022.
-
Benefits Pro. “Attracting diverse talent begins with an inclusive, ‘people-first’ culture.” Accessed on August 22nd, 2022.
-
Business News Daily. “How to Hire New Employees During the Coronavirus Outbreak.” Accessed on August 22nd, 2022.
- HR Statistics
- Average Labor Cost Percent Of Sales
- Average Time to Reach Profitability At A Startup
- Office Space Per Employee
- Recruitment Statistics
- Employee Engagement Statistics
- Work-Life Balance Statistics
- BYOD Statistics
- Paternity Leave Statistics
- Onboarding Statistics
- Average Paid Maternity Leave In Us
- Average Cost Of A Bad Hire
- Employee Theft Statistics
- Paid Family Leave Statistics
- Cost Of Hiring Statistics
- Employee Turnover Statistics
- Average Cost Of Employer Sponsored Health Insurance Statistics
- Sexual Harassment In The Workplace Statistics
- HR Statistics
- PTO Statistics
- Social Media Recruitment Statistics
- Hiring Statistics
- Out Of Prison Employment Statistics
Author
Jack Flynn is a writer for Zippia. In his professional career he’s written over 100 research papers, articles and blog posts. Some of his most popular published works include his writing about economic terms and research into job classifications. Jack received his BS from Hampshire College.