Find a Job You Really Want In
Loudest States Research Summary
-
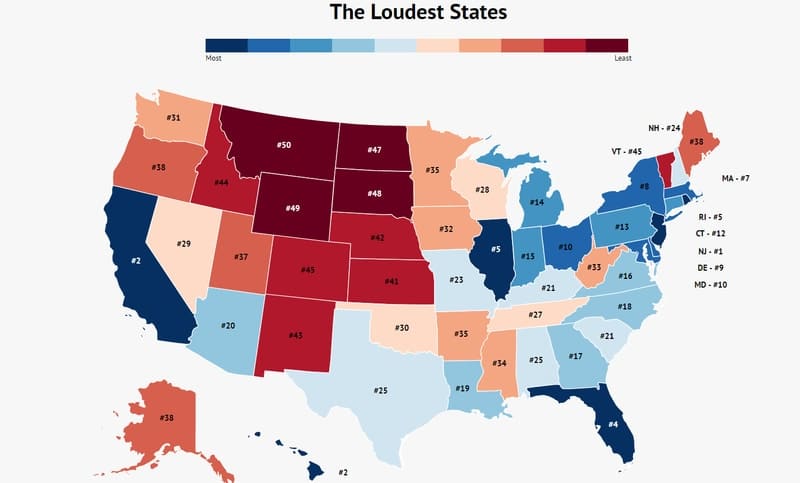
The loudest state in the U.S. is New Jersey, with 1,207 people per square mile and 371 cars per square mile.
-
The quietest state in the U.S. is Montana, with only 7 people per square mile and 3 cars per square mile.
-
Polls show that Cincinnati, Ohio, is ranked the loudest city in the U.S., with 86% of hotel-goers mentioning how loud the city was in their reviews.
We all know those neighbors who always seem to be celebrating. Whether it’s the weekend or a weekday, there’s always a party going on. If you don’t recognize this scenario, you might just be the loud one—or perhaps you’re fortunate to have considerate neighbors. For the rest of us, getting a good night’s sleep can be a challenge.
If you cherish your peace and quiet, it may be wise to steer clear of the following 10 states.
We analyzed factors such as population density, vehicle density, average household size, and home sizes to compile this list.
The 10 Loudest States
If you enjoy turning up the volume and embracing the lively atmosphere, these states are perfect for you. You might even find yourself organizing a neighborhood block party, as these areas thrive on noise.
For a complete overview of both loud and quiet states, continue reading.
How We Determined The Loudest States
We ranked each state from 1 to 50 based on four key categories:
- Home size (Smaller homes tend to be louder)
- Household/family size (More people living together typically creates more noise)
- People per square mile (Higher density often correlates with noise levels)
- Cars per square mile (More vehicles can mean more noise)
Data on average home size was sourced from Realtor.com. Smaller homes often contribute to cramped living conditions. We utilized Census data to determine the average number of residents per household in each state.
Information regarding car registrations was gathered from Statista, which helped us calculate the number of cars registered per square mile. For instance, states like Wyoming might have a high number of cars per resident, but their vast space allows for quieter driving conditions. We also leveraged the most recent Census data for population density insights.
1. New Jersey

Average House Size: 1,740
People Per Square Mile: 1,207
Cars Per Square Mile: 371
New Jersey tops the list as the loudest state, closely linked to its proximity to New York City. In just one square mile, you’ll encounter 1,207 people and 371 cars. The high population density solidifies its number one ranking, compounded by a significant number of registered vehicles.
2. California

Average House Size: 1,625
People Per Square Mile: 251
Cars Per Square Mile: 97
California comes in second place. With an average house size of 1,625 square feet and about 3 people per household, this state can be quite lively. The average household size of 2.96 also contributes to the noise level.
3. Hawaii

Average House Size: 1,308
People Per Square Mile: 222.9
Cars Per Square Mile: 79
Despite its reputation as a paradise, Hawaii can be surprisingly loud. The average house size of 1,308 square feet combined with a household size of 3.02 leads to a noisy environment.
4. Florida

Average House Size: 1,694
People Per Square Mile: 375.9
Cars Per Square Mile: 148
Florida, with its appealing oceans, also has a lively atmosphere. With 375.9 residents and 148 cars per square mile, the noise level can be significant, especially with year-round tourism.
5. Rhode Island

Average House Size: 1,688
People Per Square Mile: 1,010
Cars Per Square Mile: 395
Rhode Island ranks as the fifth loudest state, with 395 cars per square mile—the highest in the nation—alongside a population density of 1,010 people per square mile.
6. Illinois

Average House Size: 1,632
People Per Square Mile: 231
Cars Per Square Mile: 81
With a population density of 231.4 people per square mile, Illinois ranks as the sixth loudest state. Coupled with 81 cars per square mile, this creates a lively atmosphere.
7. Massachusetts

Average House Size: 1,744
People Per Square Mile: 866
Cars Per Square Mile: 278
Massachusetts, while ranking seventh, has significant stats with 278 cars and 866 people per square mile, making it feel much louder.
8. New York

Average House Size: 1,764
People Per Square Mile: 419
Cars Per Square Mile: 100
New York, famously home to the city that never sleeps, has a population density of 419 people per square mile. Despite larger average house sizes, the noise level remains noticeable with 100 cars per square mile.
9. Delaware

Average House Size: 1,800
People Per Square Mile: 484
Cars Per Square Mile: 222
Delaware ranks ninth, with a density of 484 people and 222 cars per square mile, contributing to its overall noise levels.
10. Maryland

Average House Size: 1,920
People Per Square Mile: 615
Cars Per Square Mile: 197
Rounding out the list is Maryland, which has a population density of 615 people per square mile and 197 cars per square mile, balanced by a larger average house size of 1,920 square feet.
Summary of the Loudest States
Whether you embrace the vibrancy of a loud state or prefer tranquility, this list provides insights to help you find your ideal location in the U.S. Explore both loud and quiet options to suit your lifestyle.
| Rank | State | Average House Size | People Per Square Mile | Cars Per Square Mile |
|---|---|---|---|---|
| 1 | New Jersey | 1,740 | 1,207 | 371 |
| 2 | California | 1,625 | 251 | 96 |
| 3 | Hawaii | 1,308 | 222 | 79 |
| 4 | Florida | 1,694 | 375 | 147 |
| 5 | Rhode Island | 1,688 | 1,010 | 394 |
| 6 | Illinois | 1,632 | 231 | 80 |
| 7 | Massachusetts | 1,744 | 866 | 278 |
| 8 | New York | 1,764 | 419 | 99 |
| 9 | Delaware | 1,800 | 484 | 221 |
| 10 | Maryland | 1,920 | 614 | 196 |
| 11 | Ohio | 1,620 | 283 | 112 |
| 12 | Connecticut | 1,804 | 741 | 269 |
| 13 | Pennsylvania | 1,700 | 285 | 98 |
| 14 | Michigan | 1,530 | 174 | 53 |
| 15 | Indiana | 1,742 | 184 | 62 |
| 16 | Virginia | 1,896 | 211 | 82 |
| 17 | Georgia | 1,963 | 176 | 61 |
| 18 | North Carolina | 1,800 | 206 | 69 |
| 19 | Louisiana | 1,786 | 107 | 31 |
| 20 | Arizona | 1,763 | 60 | 21 |
| 21 | Kentucky | 1,750 | 111 | 43 |
| 22 | South Carolina | 1,846 | 162 | 60 |
| 23 | Missouri | 1,650 | 88 | 30 |
| 24 | New Hampshire | 1,768 | 148 | 56 |
| 25 | Alabama | 1,800 | 95 | 42 |
| 26 | Texas | 2,031 | 104 | 31 |
| 27 | Tennessee | 1,848 | 160 | 55 |
| 28 | Wisconsin | 1,669 | 106 | 38 |
| 29 | Nevada | 1,712 | 26 | 9 |
| 30 | Oklahoma | 1,746 | 57 | 18 |
| 31 | Washington | 1,903 | 107 | 44 |
| 32 | Iowa | 1,550 | 55 | 22 |
| 33 | West Virginia | 1,714 | 76 | 23 |
| 34 | Mississippi | 1,879 | 63 | 17 |
| 35 | Arkansas | 1,792 | 57 | 17 |
| 36 | Minnesota | 1,828 | 69 | 24 |
| 37 | Utah | 2,305 | 36 | 11 |
| 38 | Alaska | 1,789 | 1 | 0.03 |
| 39 | Maine | 1,663 | 43 | 12 |
| 40 | Oregon | 1,780 | 42 | 15 |
| 41 | Kansas | 1,782 | 35 | 11 |
| 42 | Nebraska | 1,714 | 24 | 8 |
| 43 | New Mexico | 1,838 | 17 | 5 |
| 44 | Idaho | 1,932 | 20 | 7 |
| 45 | Colorado | 2,126 | 52 | 17 |
| 46 | Vermont | 1,815 | 67 | 23 |
| 47 | North Dakota | 1,788 | 11 | 3 |
| 48 | South Dakota | 1,984 | 11 | 4 |
| 49 | Wyoming | 2,052 | 6 | 2 |
| 50 | Montana | 2,040 | 7 | 3 |
Author
Amanda Postma is a writer for the Zippia Career Advice blog with a focus on creating entertaining content to help you through your job search. She received her BA from the University Of Missouri-Columbia.