20+ Mobile Game Statistics [2026]: Revenue, Monetization, Downloads, Users
Mobile game industry research summary: Since the advent of smartphones, mobile games have emerged as a primary source of entertainment and a lucrative sector for developers. Chances are, you’ve played a few mobile games and perhaps even invested some of your earnings into them.
To explore the current state of mobile games and the industry’s trajectory, we’ve compiled essential insights from our latest research:
-
As of 2026, there are over 2.3 billion mobile gamers globally.
-
Mobile gaming generates 80% of total gaming industry revenue.
-
Mobile games account for 12% of total mobile device usage time.
-
The global mobile gaming industry’s market size is estimated at $200 billion in 2026.
For a deeper analysis, we have categorized the data into the following sections:
User Demographics | Downloads | Monetization | Revenue
Mobile Gamer User Demographics
While not everyone opts for mobile gaming, those who do significantly influence the market. Certain demographics, particularly in specific countries, show higher engagement with mobile games. Here are some noteworthy insights:
-
There are over 175 million mobile gamers in the US.
This represents approximately 53% of the US population, indicating that nearly every American you encounter is likely a mobile gamer.
-
Women are 25% more likely to be mobile gamers than men.
About 57% of women engage in mobile gaming, compared to 45% of men, reflecting a notable shift from previous gaming trends.
-
33% of mobile gamers play games daily.
Mobile gaming fits seamlessly into daily routines, with many players engaging during short breaks, commutes, or downtime.
-
Women are 85% more likely to spend money on mobile games than men.
Women show a greater propensity for in-app purchases, making them a vital target demographic for many mobile game developers.
-
70% of mobile gamers are aged 18-34.
Older demographics show less interest, with only 30% of those aged 55+ participating in mobile gaming.
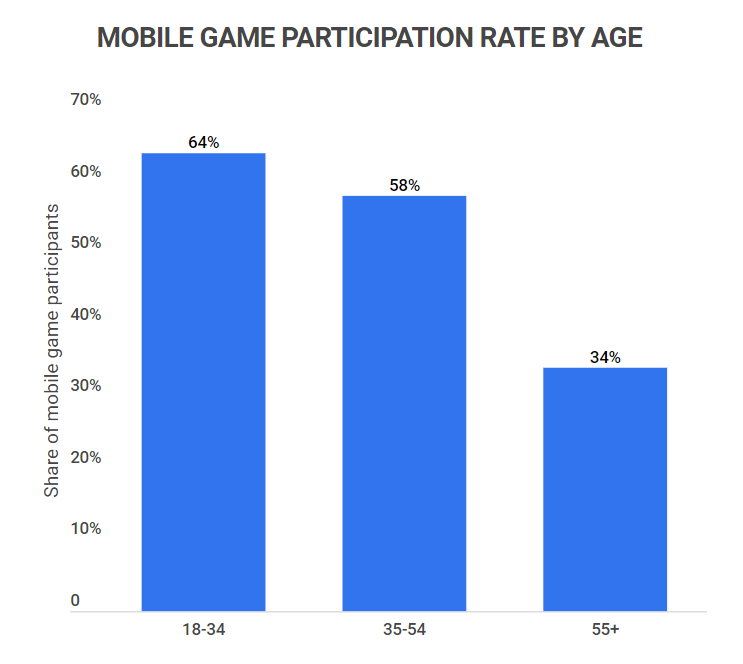
Mobile Game Participation Rate By Age
Age range Share of mobile game participants 18-34 70% 35-54 55% 55+ 30% -
Japan leads in mobile spending per capita, at $160 over nine months.
Other top countries include South Korea ($110), the United States ($100), Canada ($70), and Australia ($60).
Top 10 countries by mobile spending
Country Average mobile spending (over nine months) Japan $160 South Korea $110 United States $100 Canada $70 Australia $60 United Kingdom $50 Germany $40 France $25 Thailand $15 Russia $10
Mobile Game Downloads
Despite some fluctuations in recent years, mobile game downloads continue to reach impressive numbers, largely fueled by advancements in smartphone technology. Here are some key trends:
-
In 2025, there were 60 billion mobile game downloads.
This marks a 7.9% increase from 2024, driven by the growing diversity of mobile games available.
-
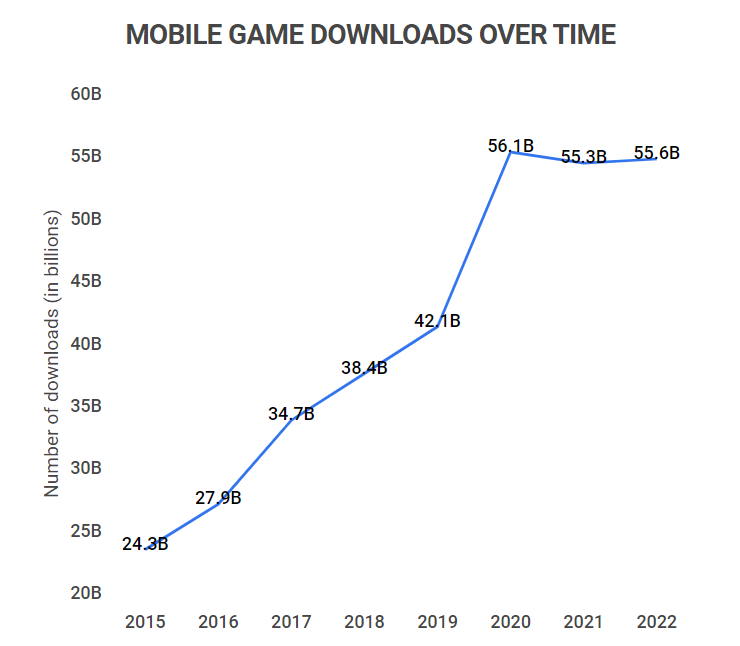
The number of annual mobile game downloads surged by 135% between 2015 and 2025.
While growth has stabilized recently, the trajectory remains upward.
Mobile game downloads over time
Year Annual mobile game downloads 2015 24.3B 2016 27.9B 2017 34.7B 2018 38.4B 2019 42.1B 2020 56.1B 2021 55.3B 2022 55.6B 2023 58B 2024 55.8B 2025 60B -
25% of iOS and 23% of Android apps downloaded are games.
Android holds a dominant share of the gaming market, with approximately 80% of all mobile gamers using Android devices.
Mobile Game Monetization
Advertising remains a primary revenue source for mobile games, particularly for free titles. Here are some notable statistics:
-
US mobile advertising spend is projected to reach $400 billion in 2026.
After hitting $355.1 billion in 2023, this represents a significant increase in mobile ad expenditures.
-
US mobile ad spending has grown by 200% between 2017 and 2023.
In 2017, mobile ad spending was approximately $111.1 billion, illustrating remarkable growth over the past few years.
US mobile ad spending over time
Year Mobile ad spending 2017 $111.1B 2018 $143.4B 2019 $175.4B 2020 $209.6B 2021 $262.5B 2022 $313.4B 2023 $355.1B 2026* $400B -
The average CPM for interstitial ads in the US is $10.50 on iOS and $11.00 on Android.
Ads on Android generally yield slightly higher revenues compared to those on iOS.
Mobile Game Revenue
Even free-to-play mobile games can yield substantial revenue through ads, in-app purchases, and a broad user base. Here are the latest trends in mobile game revenues:
-
Mobile games generated $98 billion in revenue in 2025.
This represents a stable increase compared to previous years, reinforcing mobile gaming’s profitability.
Mobile game revenue over time
Year Mobile game revenue 2019 $68.3B 2020 $86.9B 2021 $98.2B 2022 $92.2B 2023 $95B 2024 $96B 2025 $98B -
The mobile gaming industry is expected to have a CAGR of 12.5% through 2030.
By the end of the decade, the industry could be valued at approximately $400 billion, showcasing robust growth.
-
iOS mobile game revenue was 65% higher than Android’s in 2025.
iOS games generated around $60 billion in revenue, while Android’s Google Play games produced about $36 billion, a trend that has persisted in recent years.
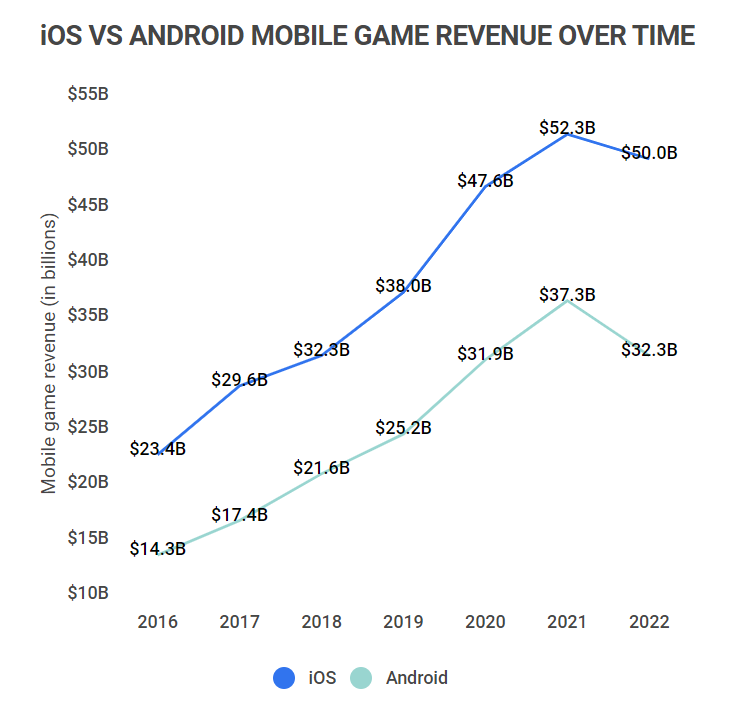
iOS vs. Android mobile game revenue over time
Year iOS game revenue Android game revenue 2016 $23.4B $14.3B 2017 $29.6B $17.4B 2018 $32.3B $21.6B 2019 $38.0B $25.2B 2020 $47.6B $31.9B 2021 $52.3B $37.3B 2022 $50.0B $32.3B 2025 $60B $36B -
Android’s share of mobile game revenue is 30% higher compared to iOS.
While iOS generates higher overall revenue, Android accounts for a larger share of its total revenue from mobile games, with games representing 65% of iOS revenue and 80% for Android.
-
RPGs remain the top mobile gaming genre, generating $25 billion in revenue in 2025.
Other leading genres include Strategy ($17 billion), Puzzle ($10 billion), Casino ($9 billion), and Shooter ($6 billion).
Mobile game revenue by genre
Genre Mobile game revenue RPG $25B Strategy $17B Puzzle $10B Casino $9B Shooter $6B Simulation $4B Sports $3.5B Lifestyle $3.2B Action $3B Geolocation AR $2.2B
Mobile Game FAQ
-
What is the most played mobile game?
As of 2026, the most popular mobile game is Subway Surfers, boasting 310 million downloads. Originally released in 2012, it continues to thrive in popularity.
Other top contenders include Stumble Guys (260 million downloads), Roblox (215 million), Candy Crush Saga (140 million), and Race Master 3D (130 million).
Mobile Game Revenue By Genre
Mobile game Number of downloads (2026) Subway Surfers 310M Stumble Guys 260M Roblox 215M Candy Crush Saga 140M Race Master 3D 130M -
What is the current state of mobile games?
The current state of mobile games is thriving and rapidly evolving. The mobile gaming market closely mirrors trends in the smartphone industry, suggesting that advancements in technology will lead to even more innovative and high-quality mobile games.
Current trends to watch in 2026 include:
-
Integration with 5G networks
-
Enhanced capabilities (larger games and improved graphics)
-
Expansion of AR and VR gaming experiences
-
-
What is the most popular mobile game genre?
Hyper-casual games dominate the mobile gaming landscape, accounting for 30% of all downloads. While RPGs lead in revenue generation, hyper-casual titles have the highest download rates.
Examples of popular hyper-casual games include Base Attack, Blob Runner, Catch And Shoot, City Takeover, and Going Balls.
Action and Puzzle genres follow closely, each surpassing 10% of total downloads.
-
Are mobile games profitable?
Yes, mobile games are highly profitable. In 2025, the industry generated $98 billion in revenue, highlighting their financial viability.
Profits primarily stem from three sources:
-
Advertisements
-
App purchases (for non-free-to-play games)
-
In-game purchases (microtransactions)
-
-
What percentage of gamers play on mobile?
62% of gamers engage on mobile devices. This exceeds the numbers for console (48%) and PC (40%) gaming. With over 68% of the global population owning a smartphone, mobile gaming has become the leading gaming platform, comprising 48% of all gaming worldwide.
-
Why is mobile gaming so popular?
Mobile games attract players for various reasons, including accessibility and flexibility. Here are key factors contributing to their popularity:
-
Accessibility: With the majority of the global population owning smartphones, most mobile games are free or low-cost, making them accessible to a wide audience. Many mobile games are designed to be easy to learn, appealing to non-gamers as well.
-
Flexibility: A significant number of mobile gamers (around 55%) play during short breaks or while multitasking, such as waiting in line or commuting, further enhancing their appeal.
-
Conclusion
The mobile gaming industry is exceptionally popular and profitable in 2026. Approaching $200 billion in revenue, it is expected to reach this milestone within the next few years. Mobile gaming constitutes a substantial 80% of total gaming industry revenue.
Despite experiencing slight fluctuations in revenue and downloads, the industry’s robust growth trajectory, with a CAGR of 12.5%, suggests it could reach $400 billion by 2030.
Overall, mobile gaming remains the dominant form of gaming in 2026 and is set to continue its ascent in the gaming landscape.
References
-
Statista – Number of users of mobile games Worldwide 2017-2027
-
Statista – Distribution of global time spent on mobile in 2020 to 2022, by category
-
Statista – Mobile gaming habits in the United States – Statistics & Facts
-
MarketingDive – Study: Women are 79% more likely than men to make in-app purchases in mobile games
-
Setupad – What are Interstitial Ads and How to Use Them Right?
-
Statista – Mobile gaming app revenue worldwide from 2019 to 2022
Author
Jack Flynn is a writer for Zippia. In his professional career he’s written over 100 research papers, articles and blog posts. Some of his most popular published works include his writing about economic terms and research into job classifications. Jack received his BS from Hampshire College.