- Industry Statistics
- Wedding Industry Statistics
- Yoga Industry Statistics
- Music Industry Statistics
- Landscaping Industry Statistics
- Bicycle Industry Statistics
- Coffee Industry Statistics
- Car Rental Industry Statistics
- Home Improvement Industry Statistics
- Insurance Industry Statistics
- Supplements Industry Statistics
- Golf Industry Statistics
- Fitness Industry Statistics
- US Media And Entertainment Industry Statistics
- Firearm Industry Statistics
- Financial Services Industry Statistics
- Health And Wellness Industry Statistics
- Trucking Industry Statistics
- Wine Industry Statistics
- Pet Industry Statistics
- Mobile App Industry Statistics
- Digital Marketing Industry Statistics
- Hotel Industry Statistics
- Retail Statistics
- Robotics Industry Statistics
- Jewelry Industry Statistics
- Appointment Scheduling statistics
- Restaurant Industry Statistics
- Food Delivery Statistics
- Food Truck Industry
- Fashion Industry
- Real Estate Industry
- US Film Industry
- US Beverage Industry
- USu202fFast Food Restaurants
- US Construction Industry
- US Book Industry
- Cosmetics Industry
- US Food Retail Industry
- US Pharmaceutical Industry
- US Healthcare Industry
- Airline Industry
- Automobile Industry
- Transportation Industry Statistics
- Event Industry Statistics
- Project Management Statistics
- Oil And Gas Industry Statistics
- Nursing Home Statistics
- Nursing Shortage Statistics
- Nursing Statistics
Music Industry Research Summary. Over the past two decades, the recorded music industry has experienced dynamic transformations, evolving from vinyl to digital platforms. This article presents current statistics that illustrate the industry’s trajectory and its future direction.
-
The U.S. recorded music industry generated $15.9 billion in revenue in 2022.
-
Music streaming comprises 65% of the global recorded music industry’s revenue.
-
82.2 million Americans subscribe to paid music streaming services.
-
From 2021 to 2026, the global music industry is expected to achieve a CAGR of 8.5%.
-
In 2022, only 9% of all music was sold as physical albums.
For a deeper analysis, we have categorized the data as follows:
Streaming | Genre | Earnings | Trends | Costs
General Music Industry Statistics
Music is an integral part of our daily lives, from catchy commercial jingles to favorite playlists on streaming platforms. Here are some fundamental facts about the music industry:
-
The global recorded music industry reached an annual revenue of $26.2 billion in 2022.
-
In 2022, the U.S. led the music market, followed by Japan, the U.K., and Germany.
-
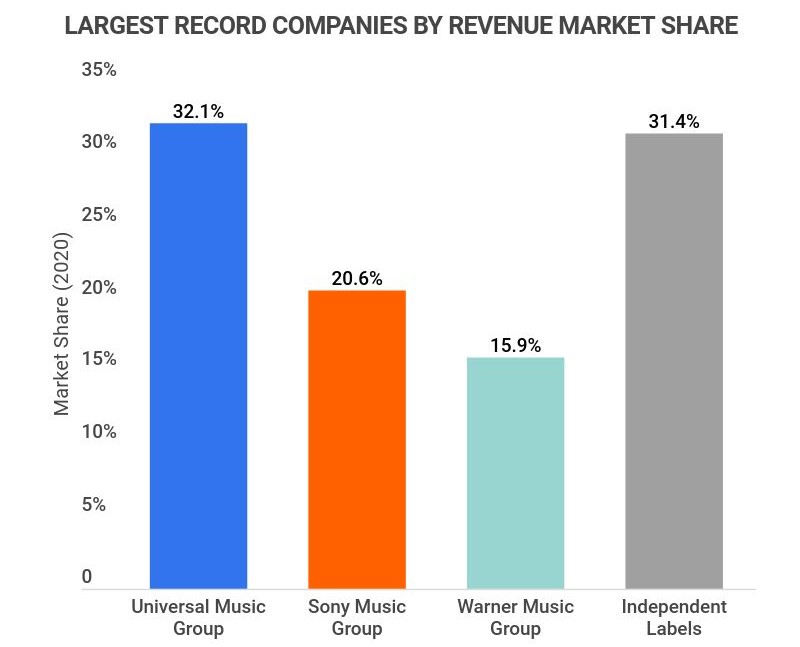
Universal Music Group remains the largest record company, capturing 32.1% of the global streaming and physical music revenue in 2020.
-
Independent record labels accounted for 31.4% of global revenue from streaming and physical music sales in 2020.
-
Sony Music Entertainment earned 20.6% of the global revenue from streaming and physical sales in 2020.
-
Warner Music Group held 15.9% of the revenue from global streaming and physical music sales in 2020.
Music Industry by Music Streaming
Streaming has surged as the predominant way to enjoy music, driving significant profits. Here are essential insights into the music streaming sector:
-
65% of the global recorded music industry’s revenue is derived from streaming.
This percentage increased from 61.9% in 2020 and encompasses both subscription audio and ad-supported streams. Here’s the revenue breakdown for 2021:
Global Recorded Music Industry Revenue Breakdown
Segment Percentage of Total Industry Revenue Subscription Audio Streams 47.3% Physical Sales 19.2% Ad-Supported Streams 17.7% Performance Rights 9.4% Downloads and Other Digital 4.3% Synchronization 2.1% -
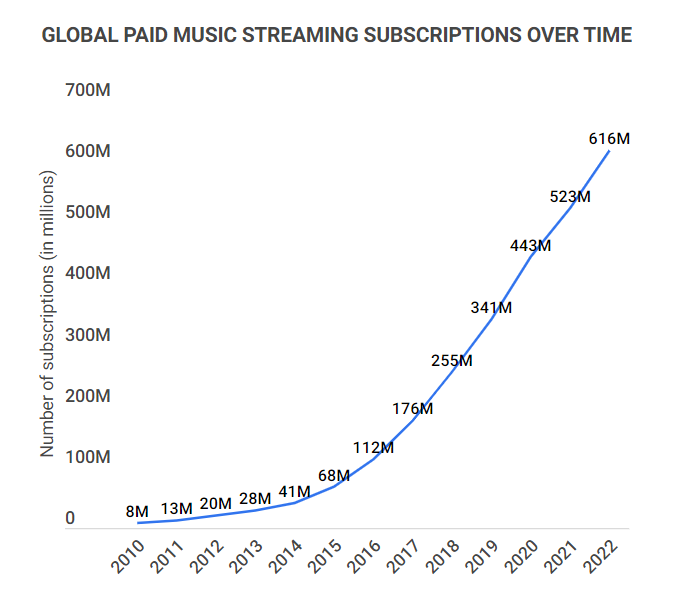
As of 2022, approximately 616.2 million people worldwide have paid music streaming subscriptions.
This figure represented an increase of 93 million from the previous year, with 82.2 million subscribers in the U.S. alone.
-
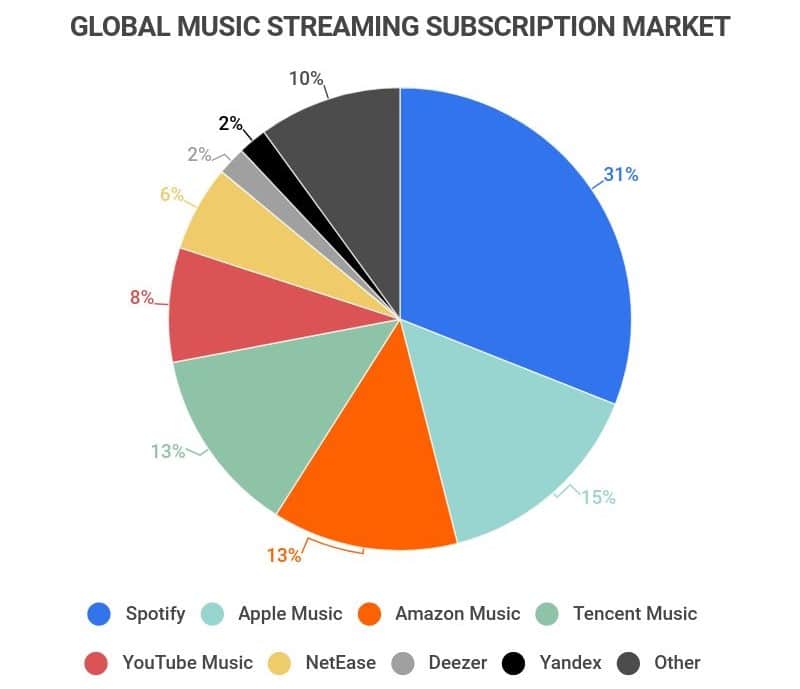
Spotify holds a 31% share of the total music streaming market, the largest among streaming services.
Apple Music follows with 15%, while Amazon Music and Tencent Music each hold 13%. YouTube Music accounts for 8%, and other platforms make up the remaining market share.
Music Industry by Music Genre
With numerous genres available, some have gained more popularity in the U.S. than others. Here’s a look at genre preferences:
-
R&B and hip hop accounted for 30.7% of all on-demand audio streams in the U.S. in 2020.
This genre also represented 28.2% of total album-equivalent consumption, encompassing physical sales, digital sales, and streaming.
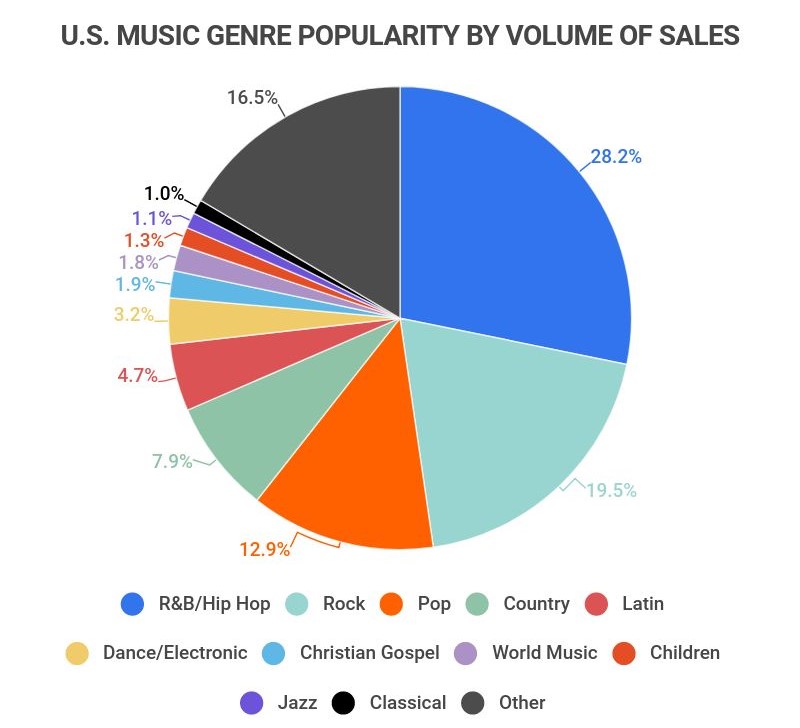
Rock secured 16.3% of all on-demand audio streams in the U.S. in 2020.
This made rock the second most popular genre, buoyed by iconic albums.
Pop claimed 13.1% of all on-demand audio streams in the U.S. in 2020.
In terms of video streams, pop outperformed rock, with 13.5% of plays compared to rock’s 11.4%.
Music Industry by Earnings
The potential for significant earnings exists within the music industry for artists and publishers, though success varies widely:
-
Independent artists generated $1.2 billion in revenue in 2020.
This represented a 34.1% increase from the previous year, amounting to 5.1% of the recorded music market.
-
Music publishers typically earn 50% of mechanical and residual income from recorded songs.
For live performances, they usually receive 25% of performers’ income.
-
Napster pays the highest per-stream rate among streaming services at $0.019 per stream.
TIDAL follows at $0.0125, while Apple Music pays $0.00783. Spotify, despite being the largest platform, pays between $0.003 and $0.005 per stream.

Music Industry Trends and Projections
As music preferences evolve, the industry continually seeks the next big hit. Here are noteworthy trends and predictions:
-
The global music industry’s revenue rose from $45.5 billion in 2012 to an estimated $59.48 billion in 2020.
Here’s the annual revenue breakdown:
Annual Global Music Industry Revenue Over Time
Year Revenue 2020 $59.48 billion 2019 $56.74 billion 2018 $53.77 billion 2017 $50.88 billion 2016 $48.23 billion 2015 $46.01 billion 2014 $44.87 billion 2013 $45 billion 2012 $45.5 billion -
From 2020 to 2021, the U.S. recorded music industry grew by 22.9%.
Revenue increased from $12.2 billion in 2020 to $15 billion in 2021.
-
The global music industry’s annual revenue surged by 18.5% from 2020 to 2021.
In 2020, the industry garnered $21.9 billion, which rose to $25.9 billion in 2021.
-
The number of Americans with paid streaming subscriptions skyrocketed from 7.9 million in 2014 to 82.2 million in 2022.
This dramatic growth illustrates the increasing popularity of streaming services.
-
Global physical music sales brought in $7.6 billion in 2012 and $5 billion in 2021.
2021’s revenue marked the highest level since 2017. Here’s the trend for physical music sales:
Annual Global Music Industry Revenue from Physical Sales Over Time
Year Annual Revenue 2020 $4.3 billion 2019 $4.5 billion 2018 $4.7 billion 2017 $5.2 billion 2016 $5.6 billion 2015 $5.8 billion 2014 $6.0 billion 2013 $6.8 billion 2012 $7.6 billion -
The U.S. recorded music industry expanded by 22.6% in 2021.
The combined U.S. and Canadian recorded music industry experienced a 22% growth rate, significantly up from their 2020 growth rate of 7.5%.
Notably, the Middle East and North Africa emerged as the fastest-growing region for the recorded music sector, exhibiting 35% growth in 2021.
Music Industry by Costs and Production
The production of music can vary widely in cost, from home studios to high-end recording facilities. Here are some insights into the financial aspects of music production:
-
Global record labels invested $5.8 billion in A&R and marketing in 2017.
-
Breaking an artist into a major market can require between $500,000 and $2 million.
-
In 2020, only 2% of music producers in the U.S. were female, while 98% were male.
-
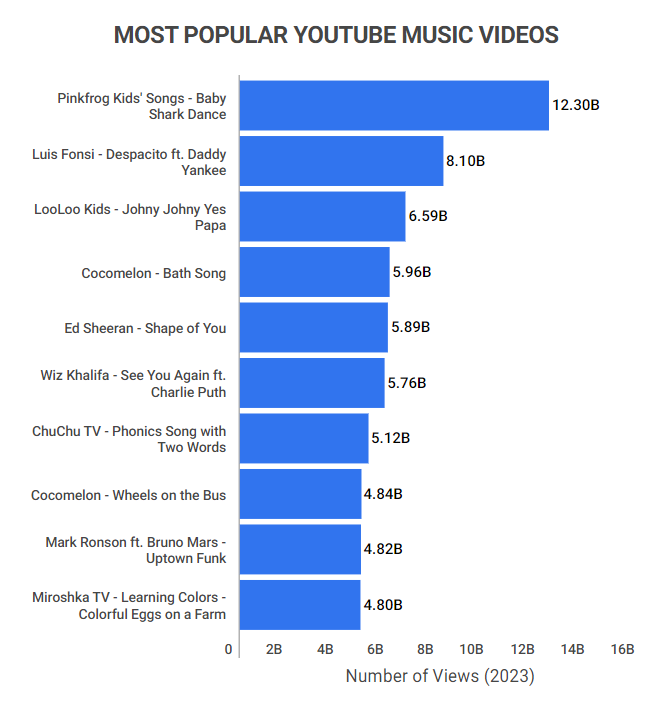
The most popular YouTube music video in 2023 is “Baby Shark,” boasting over 12.3 billion views.
Music Industry Statistics FAQ
-
How much is the music industry worth?
The music industry is valued at $26.2 billion. This figure represents the global recorded music industry’s annual revenue in 2022, with the U.S. being the largest market contributing $15.9 billion, reflecting a 6% increase from 2021. The U.S. is home to 82.2 million of the 616.2 million global paid subscribers to music streaming services.
These subscribers significantly influence the global music industry, where streaming accounts for 65% of total revenue, with subscription audio streams contributing 47.3% and ad-supported streams 17.7%. Physical music sales accounted for 19.2% of the industry’s revenue.
-
Is the music industry growing?
Yes, the music industry is experiencing growth. The global revenue increased from $56.74 billion in 2019 to $59.45 billion in 2020. In 2021, the U.S. recorded music sector alone saw a remarkable 22.9% growth rate, rising from $12.2 billion to $15 billion.
The Middle East and North Africa emerged as the fastest-growing region, with a 35% growth rate in 2021. Looking ahead, the global music industry is projected to achieve a CAGR of 8.5% from 2021 to 2026.
-
What companies dominate the music industry?
Universal Music Group, Sony Music Entertainment, and Warner Music Group are the leading players in the music industry. Together, these companies accounted for 68.6% of revenue from global streaming and physical music sales in 2020. In contrast, independent labels and artists collectively earned 31.4% of the global revenue.
In the music streaming sector, Spotify leads with a 31% market share, followed by Apple Music at 15%, and both Amazon Music and Tencent Music at 13% each.
-
What are the latest trends in the music industry?
Current trends indicate that streaming is the dominant force, and independent artists are garnering a larger share of revenue. Streaming now accounts for 65% of the global recorded music industry’s revenue, with subscription audio streams making up 47.3% and ad-supported streams accounting for 17.7%. The number of paid music streaming subscribers reached 616.2 million globally in 2022, an increase of 93 million from the previous year.
Additionally, independent artists have seen significant revenue growth, outperforming large record labels, with a revenue increase of 34.1% from 2019 to 2020.
-
How much of the music industry revenue comes from streaming?
Streaming comprises 65% of the music industry’s revenue. This share was recorded in 2021, an increase from 61.9% in 2020. Globally, 616.2 million people hold paid streaming subscriptions, with subscription audio streams representing 47.3% of total revenue and ad-supported streams contributing 17.7%.
Spotify remains the leading platform with a 31% share of subscribers, while Apple Music follows with 15%, and Amazon Music and Tencent Music each hold 13% of the market.
Conclusion
In 2022, the global recorded music industry achieved $26.2 billion in revenue, with streaming accounting for 65% of this total. Worldwide, 616.2 million individuals have paid subscriptions, including 82.2 million in the U.S.
Spotify leads the market with 31% of the subscriber base, while Apple Music ranks second with 15%. However, in terms of payment per stream to artists, Apple Music pays $0.00783 compared to Spotify’s range of $0.003 to $0.005 per stream.
References
-
Mordor Intelligence. “Music Market Landscape – Growth, Trends, COVID-19 Impact, and Forecasts (2022-2027).” Accessed on April 13, 2022.
-
Statista. “Streaming Drives Global Music Industry Resurgence.” Accessed on April 13, 2022.
-
IFPI. “Reports & Resources: Global Music Report.” Accessed on April 13, 2022.
-
Statista. “Music Industry Marches to Universal’s Beat.” Accessed on April 13, 2022.
-
Statista. “Music Piracy Still Prevalent in the Age of Streaming.” Accessed on April 13, 2022.
-
The Verge. “Streaming Music Report Sheds Light on Battle Between Spotify, Amazon, Apple, and Google.” Accessed on April 13, 2022.
-
Statista. “Paid Music Streaming Adds Half a Billion Users in a Decade.” Accessed on April 13, 2022.
-
Statista. “Number of Paid Music Streaming Subscribers in the United States From First Half 2014 to First Half 2021.” Accessed on April 13, 2022.
-
Music Business Worldwide. “Nearly a Third of All Streams in the U.S. Last Year Were of Hip-Hop and R&B Artists (As Rock Beat Pop to Second Most Popular Streaming Genre).” Accessed on April 13, 2022.
-
MIDiA. “Recorded Music Revenues Hit $23.1 Billion in 2020, with Artists Direct the Winners – Again.” Accessed on April 13, 2022.
-
CareersInMusic.com “Music Publishing Explained: How Artists Get Paid for Their Songs.” Accessed on April 13, 2022.
-
Digital Music News. “How Much Artists Make Per Stream on Spotify, Apple Music, Amazon, YouTube, Pandora, More (Updated for 2022).” Accessed on April 13, 2022.
-
Statista. “Music Industry Revenue Worldwide From 2012 to 2023.” Accessed on April 13, 2022.
-
Statista. “Recorded Music Industry Revenue in the United States From 2009 to 2020.” Accessed on April 13, 2022.
-
Statista. “Streaming Drives Global Music Industry Resurgence.” Accessed on April 13, 2022.
-
Billboard. “Record Labels’ Global Investment in A&R and Marketing Hit $5.8B in 2017, IFPI Report Finds.” Accessed April 13, 2022.
-
Beats, Rhymes, Lists. “How Much Do Record Labels Spend on Marketing Their Artists?” Accessed on April 13, 2022.
-
Statista. “Share of Producers in the Music Industry in the United States From 2012 to 2020, by Gender.” Accessed on April 13, 2022.
- Industry Statistics
- Wedding Industry Statistics
- Yoga Industry Statistics
- Music Industry Statistics
- Landscaping Industry Statistics
- Bicycle Industry Statistics
- Coffee Industry Statistics
- Car Rental Industry Statistics
- Home Improvement Industry Statistics
- Insurance Industry Statistics
- Supplements Industry Statistics
- Golf Industry Statistics
- Fitness Industry Statistics
- US Media And Entertainment Industry Statistics
- Firearm Industry Statistics
- Financial Services Industry Statistics
- Health And Wellness Industry Statistics
- Trucking Industry Statistics
- Wine Industry Statistics
- Pet Industry Statistics
- Mobile App Industry Statistics
- Digital Marketing Industry Statistics
- Hotel Industry Statistics
- Retail Statistics
- Robotics Industry Statistics
- Jewelry Industry Statistics
- Appointment Scheduling statistics
- Restaurant Industry Statistics
- Food Delivery Statistics
- Food Truck Industry
- Fashion Industry
- Real Estate Industry
- US Film Industry
- US Beverage Industry
- USu202fFast Food Restaurants
- US Construction Industry
- US Book Industry
- Cosmetics Industry
- US Food Retail Industry
- US Pharmaceutical Industry
- US Healthcare Industry
- Airline Industry
- Automobile Industry
- Transportation Industry Statistics
- Event Industry Statistics
- Project Management Statistics
- Oil And Gas Industry Statistics
- Nursing Home Statistics
- Nursing Shortage Statistics
- Nursing Statistics
Author
Abby is a writer who is passionate about the power of story. Whether it’s communicating complicated topics in a clear way or helping readers connect with another person or place from the comfort of their couch. Abby attended Oral Roberts University in Tulsa, Oklahoma, where she earned a degree in writing with concentrations in journalism and business.