Online Shopping Research Summary: Over the past few years, online shopping has significantly reshaped the consumer landscape, becoming a crucial component of retail. In 2026, while online shopping has gained substantial traction, in-person shopping continues to hold its ground due to the desire for immediate gratification and tactile experiences that online platforms cannot fully replicate.
To understand the current state of online shopping and its impact on traditional retail, we have compiled a range of compelling statistics and trends. Here are some of the key insights:
-
24% of global retail sales are online as of 2025.
-
2.8 billion people shopped online worldwide in 2022.
-
80% of consumers shop online at least once a month.
-
Global e-commerce retail sales reached $6.3 trillion in 2025.
-
A notable 65% of all shopping journeys now start online, regardless of the final purchase method.
-
27% of worldwide total retail sales are projected to be online by 2026.
For deeper insights, we have categorized the data into the following sections:
Online Shopping Vs. In-Store Shopping | Trends and Projections | Mobile Shopping | Consumer Preferences | Social Media Shopping

General Online Shopping Statistics
Understanding online shopping trends and statistics is crucial for grasping the current market dynamics. Here are some essential statistics:
-
290 million Americans shopped online in 2025.
This represents approximately 89% of the American population, indicating a continued rise in online shopping since 2020.
-
65% of buying journeys now begin online.
Consumers increasingly rely on online platforms for product research, with many in-store shoppers often transitioning to online for final purchases.
-
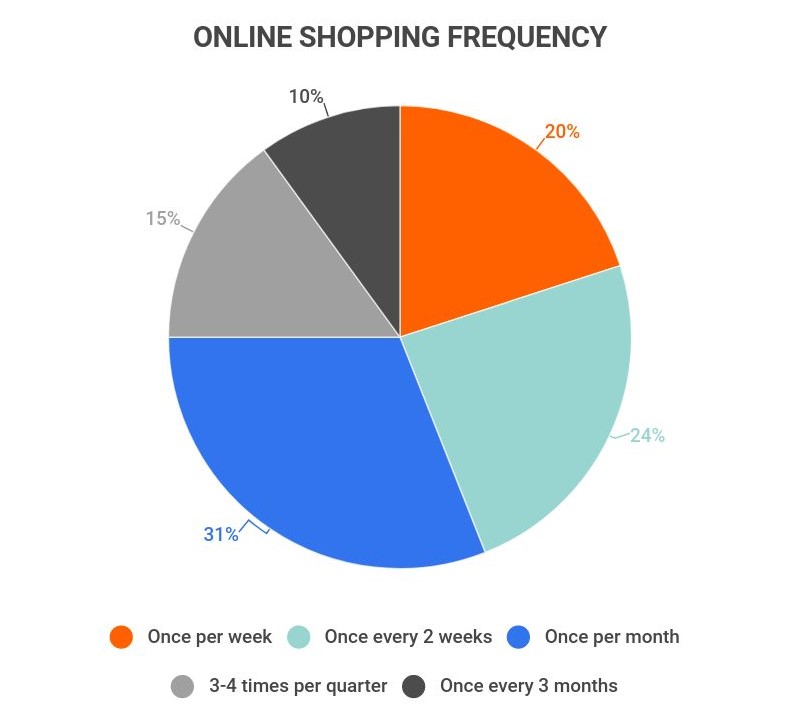
80% of consumers shop online at least once a month.
Specifically, 30% report shopping once a month, while 25% shop bi-weekly, and 25% shop weekly. Only 20% shop online a few times per quarter or less.
Online Shopping vs. In-Store Shopping Statistics
The comparison between in-store and online shopping provides valuable insights into evolving consumer preferences. Despite the growth of e-commerce, many consumers still favor in-person shopping for specific reasons:
-
Nearly 45% of consumers make an in-store purchase at least once a week, compared to 30% who purchase online weekly.
-
70% of consumers prefer in-store shopping to avoid delivery fees.
-
65% of consumers favor in-person shopping for the immediate possession of items.
-
75% of shoppers say they prefer in-store shopping to physically see or try on items.
-
85% of U.S. consumers prefer buying groceries in person rather than online.
Online Shopping Trends and Projections
Online shopping has seen extraordinary growth since its inception. Two decades ago, it was relatively niche, but now it is a staple in the U.S. retail landscape:
-
Online sales grew by over 75% between 2021 and 2025.
In 2021, online sales totaled $800 billion. By 2025, they reached $1.4 trillion.
-
U.S. e-commerce sales are projected to reach $1.3 trillion by 2026.
This would represent an increase of over 30% year-over-year since 2025.
-
It’s anticipated that there will be over 300 million online shoppers in the United States by 2026.
This reflects a steady rise from 290 million online shoppers in 2025, indicating a growth rate of approximately 3.4%.
Percentage of U.S. Retail Sales That Were Online 2012-2025
| Year | Online Sales | Offline Sales |
|---|---|---|
| 2012 | 5% | 95% |
| 2013 | 5.8% | 94.2% |
| 2014 | 6.5% | 93.5% |
| 2015 | 7.3% | 92.7% |
| 2016 | 8% | 92% |
| 2017 | 9% | 91% |
| 2018 | 9.9% | 90.1% |
| 2019 | 11.1% | 88.9% |
| 2020 | 14.2% | 85.8% |
| 2021 | 15.5% | 84.5% |
| 2022 | 18.2% | 81.8% |
| 2023 | 20.5% | 79.5% |
| 2024 | 22.7% | 77.3% |
| 2025 | 24% | 76% |
Mobile and Social Media Shopping Statistics
Mobile devices and social media continue to shape online shopping trends. Here are some key statistics that highlight their influence:
-
60% of smartphone users enjoy browsing products on their devices.
This trend is fueled by the convenience and ease of navigation on mobile platforms.
-
80% of smartphone users admit to making impulse purchases online.
The engaging design and presentation of mobile shopping apps contribute to this phenomenon.
-
85% of shoppers conduct online research before making a purchase.
Retailers must ensure a robust online presence to capture this audience.
-
In 2022, 40% of U.S. consumers reported purchasing items directly through social media.
This percentage is expected to rise as more brands enhance their social media marketing strategies.
Online Shopping Statistics by Consumer Preferences and Opinions
Consumer preferences play a vital role in shaping online shopping behaviors. Here are some essential statistics that illustrate these trends:
-
80% of online shoppers primarily rely on product images when deciding on purchases.
High-quality visuals significantly increase the likelihood of conversions.
-
Approximately 60% of U.S. consumers prefer online shopping during the holiday season.
Conversely, around 40% plan to shop in-store during this peak period.
-
Over 85% of consumers are deterred from shopping at a store due to inconvenient return policies.
This is why many opt for large retailers with user-friendly return processes.
-
Fashion purchases constitute 25% of total online sales in the United States.
This segment has shown consistent growth in the past two decades.
Online Shopping Statistics FAQ
-
Is online shopping more popular than in-store shopping?
No, in-store shopping remains more popular than online shopping. As of 2025, in-person retail accounts for 76% of all sales, while online sales represent 24%. However, the upward trajectory indicates a potential shift towards online dominance in the next decade.
-
What percentage of global retail sales are online?
24% of global retail sales are online as of 2025. This demonstrates the sustained growth of e-commerce, even as traditional shopping persists.
-
Why do customers prefer in-store shopping?
Many customers value in-person shopping for its immediate satisfaction and the ability to physically evaluate products. This tactile experience is a significant factor for many consumers.
-
What percentage of Americans shop online?
89% of the American population shopped online at least once in 2025. The growth of online shopping continues to rise, especially among those in remote areas.
-
How many people bought something online in 2022?
Over 2.8 billion people globally made online purchases in 2022. This figure highlights the widespread acceptance of online shopping across diverse demographics.
Conclusion
The evolution of online shopping has transitioned from a niche market to a major retail force over the years. As of 2025, 24% of global retail sales are attributed to online shopping. With over 2.8 billion people engaging in online purchases in 2022, the growth trajectory remains strong.
In the U.S., more than 290 million individuals shopped online in 2025, accounting for approximately 89% of the population. Global e-commerce sales hit nearly $6.3 trillion, underscoring the significant shift in consumer buying habits.
Today, a growing number of consumers view online shopping as their primary method for purchasing goods, with 80% shopping online monthly. Despite this, many still prefer in-person shopping for the immediate acquisition of products, with 70% valuing this aspect to avoid delivery fees.
As we look ahead, predictions indicate that 27% of total retail sales globally will occur online by 2026. U.S. e-commerce sales are projected to exceed $1.3 trillion, with over 300 million online shoppers anticipated in the same year.
References
-
Statista. • E-commerce share of total retail sales. Accessed on February 6, 2026
-
Statista. E-commerce worldwide – statistics & facts. Accessed on February 6, 2026
-
International Post Corporation. Cross-Border E-Commerce Shopper Survey International Post Corporation. Accessed on February 6, 2026
-
Statista. • Global retail e-commerce market size 2014-2026 | Statista. Accessed on February 6, 2026
-
Shopify. Global Ecommerce: Stats and Trends to Watch to Succeed Internationally (2025). Accessed on February 6, 2026
-
Statista. • Number of digital shoppers in the US 2022 | Statista. Accessed on February 6, 2026
-
Think With Google. Online shopping behavior statistics. Accessed on February 6, 2026
-
Business News Daily. Shoppers Still Prefer In-Store Over Online Shopping. Accessed on February 6, 2026
-
Retail Wire. Online grocery shopping is pretty much all about convenience. Accessed on February 6, 2026
-
Global News Wire. The joy of online discovery; 54% of global shoppers enjoy virtual window shopping more than in-store browsing. Accessed on February 6, 2026
-
Rag Trader. This makes 77% of customers impulse buy on mobile. Accessed on February 6, 2026
-
Sales Lion. 81% of Shoppers Research their Product Online before Purchasing. Accessed on February 6, 2026
-
Statista. • US online consumers social media online shopping | Statista. Accessed on February 6, 2026
-
Digital Commerce 360. US ecommerce grows 14.2% in 2021 | Digital Commerce 360. Accessed on February 6, 2026
-
Digital Commerce 360. [Infographic] Ecommerce vs. total retail sales from 2012-2021. Accessed on February 6, 2026
-
Statista. • US e-commerce market size 2016-2026 | Statista. Accessed on February 6, 2026
-
Finances Online. Number of Digital Shoppers in the US 2025/2026: Demographics, Statistics, and Predictions. Accessed on February 6, 2026
-
Seattle Web Design. Three Huge Statistics About eCommerce Product Photography (And What to Do About Them). Accessed on February 6, 2026
-
Statista. • US in-store vs. online holiday shopping 2021 | Statista. Accessed on February 6, 2026
-
ReadyCloud. Ecommerce Returns Statistics | ReadyCloud. Accessed on February 6, 2026
-
Statista. Fashion e-commerce in the United States. Accessed on February 6, 2026
-
Statista. E-commerce as percentage of total retail sales in the United States from 2013 to 2026. Accessed on February 6, 2026
Author
Sky Ariella is a professional freelance writer, originally from New York. She has been featured on websites and online magazines covering topics in career, travel, and lifestyle. She received her BA in psychology from Hunter College.