Renewable Energy by State: Insights for 2026 As the shift towards sustainable practices accelerates, renewable energy is at the forefront of creating a greener future. In the wake of evolving energy policies and technological advancements, understanding the landscape of renewable energy production, job opportunities, and incentives across the United States is essential.
Here’s what our updated research reveals about renewable energy in each state:
-
Texas leads the nation in renewable energy production, generating 136.8 million megawatt hours in 2022.
-
South Dakota boasts the highest percentage of renewable energy usage, with 83% of its electricity coming from renewable sources.
-
New York offers the most attractive solar incentives and subsidies in the country.
-
Vermont has the highest proportion of renewable energy jobs, accounting for 5.37% of all employment in the state.
-
California is home to over 505,000 jobs in the renewable energy sector, leading the nation in employment opportunities.
Renewable Energy Production by State
The landscape of renewable energy production has evolved significantly, with various states investing in differing technologies based on their unique geographic and climatic advantages. Here are the latest insights into renewable energy production by state:
Renewable Energy Production and Consumption by State
| State | Total Renewable Energy Produced (in thousand MWh) | Share of Renewable Energy (vs. Fossil Fuels) | Share of State-Produced Energy Consumed |
|---|---|---|---|
| Alabama | 4,063 MWh | 9% | 2.7% |
| Alaska | 180 | 27% | 2.7% |
| Arizona | 8,858 | 13% | 8.5% |
| Arkansas | 1,591 | 7% | 2.5% |
| California | 69,488 | 36% | 34.7% |
| Colorado | 19,481 | 33% | 33.8% |
| Connecticut | 1,134 | 2% | 2.6% |
| Delaware | 141 | 2% | 2.8% |
| Florida | 15,261 | 4% | 6.0% |
| Georgia | 12,441 | 7% | 9.9% |
| Hawaii | 1,744 | 14% | 18.5% |
| Idaho | 3,825 | 69% | 22.9% |
| Illinois | 24,382 | 11% | 13.0% |
| Indiana | 10,670 | 10% | 11.4% |
| Iowa | 43,804 | 59% | 62.5% |
| Kansas | 29,429 | 46% | 46.6% |
| Kentucky | 468 | 7% | 0.7% |
| Louisiana | 2,326 | 2% | 2.2% |
| Maine | 4,967 | 56% | 42.2% |
| Maryland | 1,565 | 9% | 4.1% |
| Massachusetts | 3,140 | 15% | 15.0% |
| Michigan | 11,876 | 8% | 10.2% |
| Minnesota | 17,170 | 26% | 28.3% |
| Mississippi | 1,800 | 1% | 2.7% |
| Missouri | 7.711 | 11% | 9.8% |
| Montana | 3,959 | 51% | 14.9% |
| Nebraska | 11,998 | 29% | 29.6% |
| Nevada | 13,091 | 22% | 31.2% |
| New Hampshire | 1,491 | 9% | 8.4% |
| New Jersey | 2,287 | 2% | 3.5% |
| New Mexico | 16,078 | 36% | 40.5% |
| New York | 8,170 | 28% | 6.5% |
| North Carolina | 13,841 | 13% | 10.5% |
| North Dakota | 16,754 | 39% | 37.2% |
| Ohio | 4,532 | 3% | 3.3% |
| Oklahoma | 37,694 | 44% | 44.5% |
| Oregon | 11,427 | 64% | 18.1% |
| Pennsylvania | 5,637 | 3% | 2.4% |
| Rhode Island | 815 | 5% | 9.2% |
| South Carolina | 4,551 | 5% | 4.6% |
| South Dakota | 10,195 | 83% | 53.8% |
| Tennessee | 1,355 | 15% | 1.7% |
| Texas | 136,827 | 26% | 26.6% |
| Utah | 5,048 | 11% | 12.7% |
| Vermont | 1,058 | 76% | 50.5% |
| Virginia | 8,174 | 5% | 9.0% |
| Washington | 10,841 | 74% | 9.0% |
| West Virginia | 1,946 | 4% | 3.4% |
| Wisconsin | 3,740 | 6% | 6.1% |
| Wyoming | 10,586 | 22% | 23.6% |
-
Iowa leads in the consumption of renewable energy, using 62.5% of what it produces.
While South Dakota has the highest percentage of in-state electricity production from renewables, Iowa maximizes its renewable energy consumption. In stark contrast, Kentucky utilizes less than 1% of its produced renewables.
Top 10 States by Share of State-Produced Energy Consumed
State Renewable Energy Consumed Iowa 62.5% South Dakota 53.8% Vermont 50.5% Kansas 46.6% Oklahoma 44.5% Maine 42.2% New Mexico 40.5% North Dakota 37.2% California 34.7% Colorado 33.8% -
South Dakota maintains 83% renewable energy in-state electricity generation.
However, Mississippi lags significantly, with only 1% of its energy consumption derived from renewables, positioning it among the lowest in the nation.
Top 10 States by Share of Renewable Energy Produced
State Renewable Energy Produced South Dakota 83% Vermont 76% Washington 74% Idaho 69% Oregon 64% Iowa 59% Maine 56% Kansas 46% Oklahoma 44% North Dakota 39% -
Texas remains the largest renewable energy producer in the U.S. with 136.8 million MWh generated in 2022.
Following Texas, the leading states in renewable energy production include:
Top 10 States by Total Renewable Energy Produced
State Renewable Energy Produced (in thousand MWh) Texas 136,827 MWh California 69,488 Iowa 43,804 Oklahoma 37,694 Kansas 29,429 Illinois 24,382 Colorado 19,481 Minnesota 17,170 North Dakota 16,754 New Mexico 16,078
Renewable Energy Production by Source
Various sources contribute to the renewable energy mix, and states differ in their capabilities to harness these resources effectively. Below are insights into renewable energy production by source:
Renewable Energy Produced as a Share of Total Energy Produced by State
| State | Hydro Energy | Wind Energy | Solar Energy |
|---|---|---|---|
| Alabama | 8% | 0% | 0% |
| Alaska | 25% | 2% | 0% |
| Arizona | 6% | 1% | 6% |
| Arkansas | 7% | 0% | 1% |
| California | 8% | 8% | 19% |
| Colorado | 3% | 27% | 3% |
| Connecticut | 1% | 0% | 1% |
| Delaware | 0% | 0% | 2% |
| Florida | 0% | 0% | 4% |
| Georgia | 3% | 0% | 4% |
| Hawaii | 1% | 8% | 6% |
| Idaho | 49% | 17% | 3% |
| Illinois | 0% | 11% | 0% |
| Indiana | 0% | 9% | 1% |
| Iowa | 2% | 57% | 0% |
| Kansas | 0% | 46% | 0% |
| Kentucky | 7% | 0% | 0% |
| Louisiana | 2% | 0% | 0% |
| Maine | 27% | 28% | 2% |
| Maryland | 6% | 1% | 2% |
| Massachusetts | 6% | 1% | 8% |
| Michigan | 1% | 7% | 0% |
| Minnesota | 1% | 21% | 3% |
| Mississippi | 0% | 0% | 1% |
| Missouri | 2% | 9% | 0% |
| Montana | 37% | 14% | 0% |
| Nebraska | 3% | 26% | 0% |
| Nevada | 5% | 1% | 16% |
| New Hampshire | 6% | 3% | 0% |
| New Jersey | 0% | 0% | 2% |
| New Mexico | 0% | 30% | 5% |
| New York | 23% | 3% | 1% |
| North Carolina | 5% | 0% | 8% |
| North Dakota | 5% | 35% | 0% |
| Ohio | 0% | 2% | 1% |
| Oklahoma | 3% | 41% | 0% |
| Oregon | 46% | 16% | 2% |
| Pennsylvania | 1% | 1% | 0% |
| Rhode Island | 0% | 2% | 3% |
| South Carolina | 3% | 0% | 2% |
| South Dakota | 29% | 54% | 0% |
| Tennessee | 14% | 0% | 0% |
| Texas | 0% | 23% | 3% |
| Utah | 1% | 2% | 8% |
| Vermont | 52% | 16% | 8% |
| Virginia | 1% | 0% | 4% |
| Washington | 66% | 9% | 0% |
| West Virginia | 2% | 3% | 0% |
| Wisconsin | 3% | 3% | 1% |
| Wyoming | 2% | 20% | 0% |
-
Texas has the highest installed capacity of wind energy at 37,422 Megawatts.
While Texas leads in wind energy production, Iowa has the largest share of its energy generated from wind at 57%. Additionally, 14 states do not produce any wind energy:
-
Alabama
-
Arkansas
-
Connecticut
-
Delaware
-
Florida
-
Georgia
-
Kentucky
-
Louisiana
-
Mississippi
-
New Jersey
-
North Carolina
-
South Carolina
-
Tennessee
-
Virginia
Top 10 States by Total Wind Energy Produced
State Wind Energy Produced (Megawatts) Share of Total Energy Produced Texas 37,422 MW 23% Iowa 12,428 57% Oklahoma 11,992 41% Kansas 8,245 46% Illinois 7,037 11% California 6,117 8% Colorado 5,198 27% Minnesota 4,578 21% North Dakota 4,302 35% New Mexico 4,235 30% -
-
California produces the most solar energy at 31,873 Megawatts.
With its favorable climate, California leads the nation in solar energy production, where solar constitutes 19% of its total energy mix. Below are the top solar-producing states:
Top 10 States by Total Solar Energy Produced
State Solar Energy Produced (Megawatts) Share of Total Energy Produced California 31,873 MW 19% Texas 9,311 3% North Carolina 7,132 8% Florida 7,074 4% Arizona 5,247 6% Nevada 3,904 8% New Jersey 3,653 16% Massachusetts 3,263 8% Georgia 3,069 4% New York 2,840 1% -
Washington State produced 31% of all U.S. hydropower in 2022.
Hydropower remains a cornerstone of renewable energy, with Washington leading in production. Here are the top states for hydropower generation:
Top 10 States by Total Hydro Energy Produced
State Hydro Energy Produced (million kWh) Share of Total Energy Produced Washington 80,510 million kWh 66% Oregon 32,107 46% New York 27,461 23% California 17,301 8% Montana 10,302 37% Nevada 10,094 5% Tennessee 9,830 14% Idaho 8,839 49% Arizona 5,511 6% South Dakota 5,488 29% -
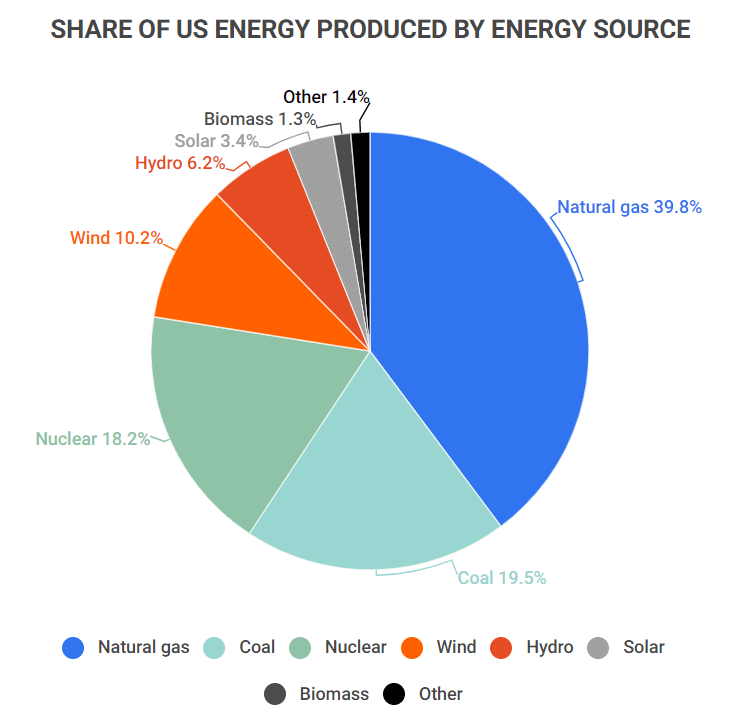
Renewable energy comprises 21.5% of all U.S. energy sources.
Of this, wind contributes 10.2%, hydropower 6.2%, solar 3.4%, biomass 1.3%, and geothermal 0.4%. In contrast, natural gas leads the chart at 39.8% of total energy production.
Renewable Energy Incentives by State
Many states provide incentives to promote the adoption of renewable energy solutions, making investments in solar panels and other renewable technologies more affordable. Here are some current statistics on state-level incentives:
-
Twenty states now offer energy credit incentives for solar panel installations.
Nearly half of all U.S. states provide energy credit incentives to homeowners looking to install solar panels, including:
-
Arizona
-
California
-
Colorado
-
Connecticut
-
Florida
-
Hawaii
-
Illinois
-
Massachusetts
-
Maryland
-
Nevada
-
New Hampshire
-
New Jersey
-
New Mexico
-
New York
-
Pennsylvania
-
Rhode Island
-
South Carolina
-
Texas
-
Vermont
-
Wisconsin
-
-
The federal Residential Clean Energy Credit now covers 30% of the costs for new, qualified clean energy property.
The U.S. federal government is incentivizing renewable energy adoption, particularly through solar panel installations, allowing homeowners to receive up to 30% of installation costs covered as of 2023.
Renewable Energy Jobs by State
Job opportunities in the renewable energy sector vary widely across states. Here are key statistics illustrating the best states for renewable energy jobs:
| State | Number of Renewable Energy Jobs |
|---|---|
| Alabama | 41,984 |
| Alaska | 5,006 |
| Arizona | 59,383 |
| Arkansas | 19,965 |
| California | 505,083 |
| Colorado | 61,179 |
| Connecticut | 41,458 |
| Delaware | 12,268 |
| Florida | 158,467 |
| Georgia | 75,211 |
| Hawaii | 12,873 |
| Idaho | 13,409 |
| Illinois | 120,775 |
| Indiana | 86,215 |
| Iowa | 30,393 |
| Kansas | 23,821 |
| Kentucky | 35,437 |
| Louisiana | 28,094 |
| Maine | 12,493 |
| Maryland | 80,025 |
| Massachusetts | 113,409 |
| Michigan | 119,853 |
| Minnesota | 57,931 |
| Mississippi | 20,018 |
| Missouri | 54,397 |
| Montana | 9,898 |
| Nebraska | 18,822 |
| Nevada | 32,378 |
| New Hampshire | 15,915 |
| New Jersey | 53,334 |
| New Mexico | 12,014 |
| New York | 160,642 |
| North Carolina | 103,854 |
| North Dakota | 8,614 |
| Ohio | 110,272 |
| Oklahoma | 21,602 |
| Oregon | 53,869 |
| Pennsylvania | 92,773 |
| Rhode Island | 14,309 |
| South Carolina | 44,011 |
| South Dakota | 11,860 |
| Tennessee | 77,685 |
| Texas | 238,884 |
| Utah | 43,452 |
| Vermont | 15,668 |
| Virginia | 92,315 |
| Washington | 76,905 |
| West Virginia | 9,540 |
| Wisconsin | 71,370 |
| Wyoming | 8,226 |
-
California offers the highest number of renewable energy jobs at over 505,000.
Despite leading in job numbers, California ranks 6th for the share of renewable energy jobs as a percentage of total employment. Vermont, with 5.37% of jobs in renewable energy, tops this category.
Top 10 States for Renewable Energy Jobs
State Share of Overall Workforce Renewable Energy Jobs Available Vermont 5.37% 15,668 Massachusetts 3.29% 113,409 Maryland 3.12% 80,025 Rhode Island 3.07% 14,309 Wyoming 3.05% 8,226 California 3.01% 505,083 Oregon 2.84% 53,869 Michigan 2.81% 119,853 Delaware 2.79% 12,268 Indiana 2.74% 86,215 -
Alaska has the fewest renewable energy jobs, with just over 5,000 available.
The small population contributes to this low number, while Oklahoma has the lowest share of renewable energy jobs relative to its workforce, with only 1.31% (20,132 jobs).
Bottom 10 States for Renewable Energy Jobs
State Share of Overall Workforce Renewable Energy Jobs Available Oklahoma 1.31% 21,602 New Jersey 1.33% 53,334 West Virginia 1.39% 9,540 New Mexico 1.44% 12,014 Louisiana 1.52% 28,094 Arkansas 1.59% 19,965 Pennsylvania 1.59% 92,773 Idaho 1.64% 13,409 Georgia 1.66% 75,211 Kansas 1.70% 23,821
Renewable Energy FAQ
-
Which state produces the most renewable energy?
Texas is the leading producer of renewable energy, generating 136.8 million megawatt hours. However, despite this output, renewables account for only about 26% of the state’s total energy production. In contrast, South Dakota generates less renewable energy overall (10,195 million MWh) but relies on renewables for 83% of its total energy production.
-
Which state has the most renewable energy jobs?
California leads in renewable energy employment with over 505,000 jobs. However, it ranks 6th in terms of the share of renewable energy jobs within the overall workforce. Vermont holds the top spot, with 5.37% of its jobs in the renewable sector, despite having only 15,668 jobs in total.
Conclusion
The adoption of renewable energy is on the rise across the United States, with renewables now accounting for 21.5% of all energy production. The federal government is enhancing its support through residential clean energy credits, making it easier for homeowners to transition to renewable sources.
However, the landscape varies significantly from state to state. Texas remains a leader in production capacity, while states like South Dakota and Iowa excel in utilizing their renewable resources effectively. In contrast, states like Mississippi and Kentucky continue to fall behind.
As demand for clean energy grows, we can expect an ongoing increase in both renewable energy production and job opportunities, reflecting a broader national shift towards sustainability.
References
-
Climate Connections – Which state is winning at renewable energy production?
-
EcoWatch – 2023 Solar Incentives and Rebates (Top 9 Ranked States)
-
U.S. News – These States Have the Most Clean Energy Jobs
-
Nebraska Energy Statistics – Wind Facilities’ Installed Capacity by State
-
EcoWatch – These 10 States Are Leading Solar Energy Installation in 2023
-
EIA – Hydropower explained
-
Renewable Energy World – Here’s how your state ranks by total clean energy jobs
Author
Jack Flynn is a writer for Zippia. In his professional career he’s written over 100 research papers, articles and blog posts. Some of his most popular published works include his writing about economic terms and research into job classifications. Jack received his BS from Hampshire College.