- Industry Statistics
- Wedding Industry Statistics
- Yoga Industry Statistics
- Music Industry Statistics
- Landscaping Industry Statistics
- Bicycle Industry Statistics
- Coffee Industry Statistics
- Car Rental Industry Statistics
- Home Improvement Industry Statistics
- Insurance Industry Statistics
- Supplements Industry Statistics
- Golf Industry Statistics
- Fitness Industry Statistics
- US Media And Entertainment Industry Statistics
- Firearm Industry Statistics
- Financial Services Industry Statistics
- Health And Wellness Industry Statistics
- Trucking Industry Statistics
- Wine Industry Statistics
- Pet Industry Statistics
- Mobile App Industry Statistics
- Digital Marketing Industry Statistics
- Hotel Industry Statistics
- Retail Statistics
- Robotics Industry Statistics
- Jewelry Industry Statistics
- Appointment Scheduling statistics
- Restaurant Industry Statistics
- Food Delivery Statistics
- Food Truck Industry
- Fashion Industry
- Real Estate Industry
- US Film Industry
- US Beverage Industry
- USu202fFast Food Restaurants
- US Construction Industry
- US Book Industry
- Cosmetics Industry
- US Food Retail Industry
- US Pharmaceutical Industry
- US Healthcare Industry
- Airline Industry
- Automobile Industry
- Transportation Industry Statistics
- Event Industry Statistics
- Project Management Statistics
- Oil And Gas Industry Statistics
- Nursing Home Statistics
- Nursing Shortage Statistics
- Nursing Statistics
Research Summary. The retail industry is an integral part of our daily lives, from major retailers like Walmart to local shops, providing essential goods and services. Whether it’s a quick trip to Target or browsing a neighborhood boutique, retail shapes our consumer experiences.
In this updated analysis, we explore the current landscape of retail stores in the U.S. Based on our comprehensive research, we found:
-
E-commerce now represents 15% of total retail sales in the U.S., while traditional physical stores account for 85% of sales.
-
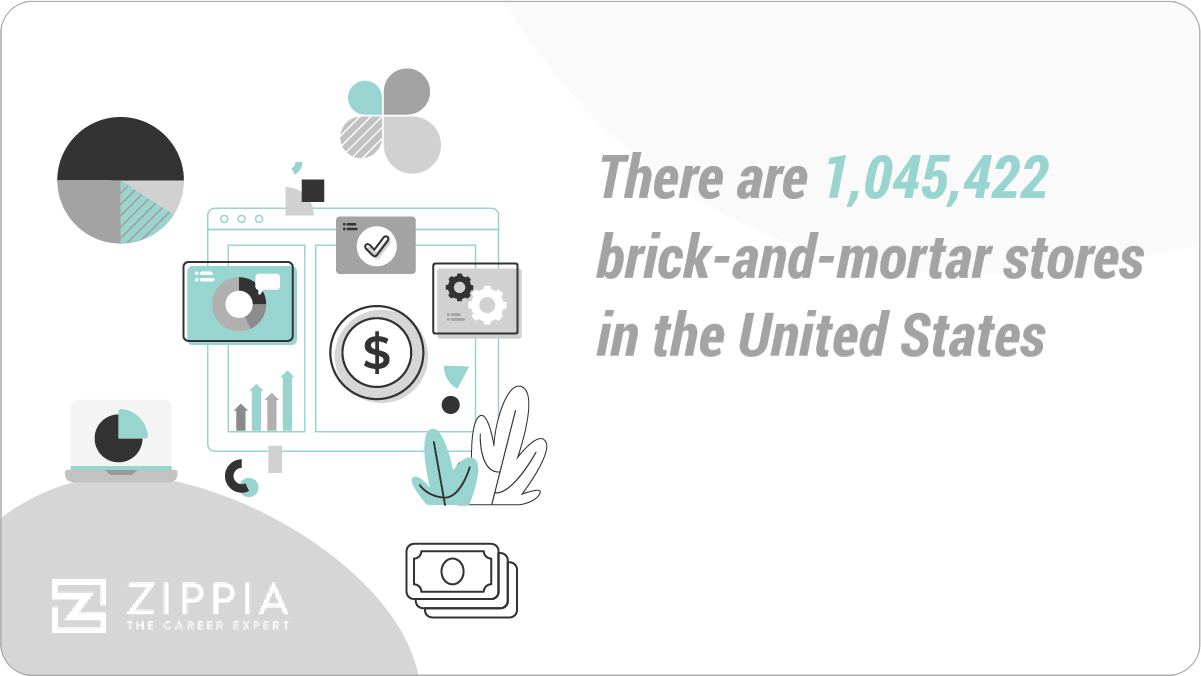
As of 2023, there are approximately 1,050,000 brick-and-mortar retail establishments across the U.S.
-
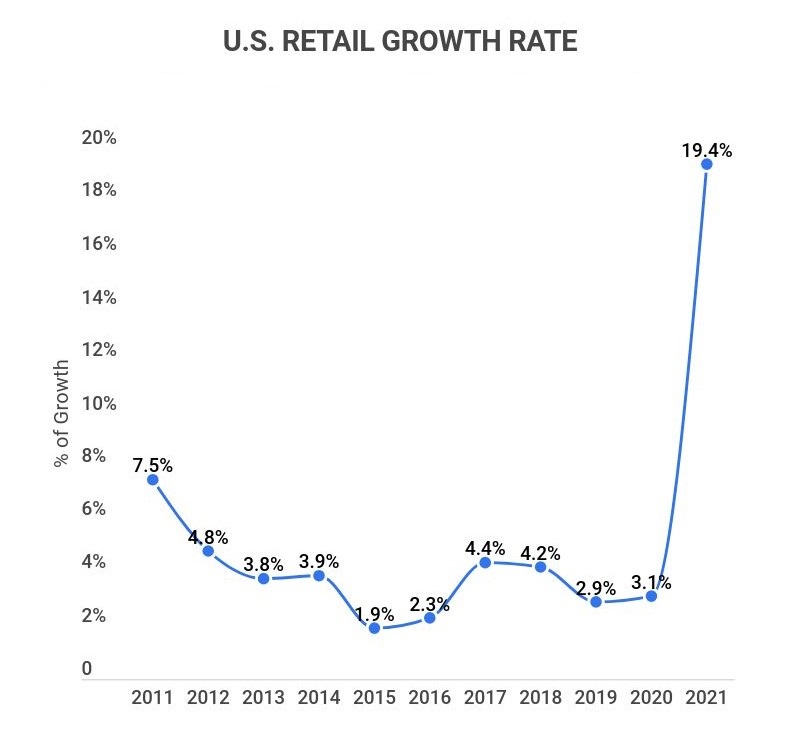
U.S. retail annual growth rate reached 16.29% from 2010 to 2023.
-
75% of consumers prefer brands that offer personalized shopping experiences.
-
U.S. retail sales have exceeded $4.8 trillion as of 2023, marking a significant recovery and growth since the pandemic.
-
Total global retail sales are valued at an impressive $27.5 trillion as of 2023.
For more detailed insights, we have categorized the data below:
Brick and Mortar Stores | Consumer Preferences | E-commerce | Trends
General Retail Statistics
The retail industry plays a crucial role in the U.S. economy, providing essential goods and services. Here are some key statistics highlighting the significance of retail:
-
The retail sector is the #1 employment sector in the U.S., employing over 52 million people.
Retail remains the largest sector, with 9.8 million employees directly involved. It is followed by education (7 million), local government (5.6 million), and healthcare (4.7 million).
-
There are approximately 1,050,000 brick-and-mortar retail establishments across the U.S.
This figure reflects a steady growth in retail, indicating resilience and adaptation in the market.
-
E-commerce makes up 15% of total retail sales in the U.S. as of 2023.
This percentage has steadily risen from previous years, highlighting the increasing importance of online shopping in consumer behavior.
-
Approximately 76% of U.S. small business retailers have a website.
This number emphasizes the growing necessity for small retailers to establish a digital presence to capture online sales.
-
Walmart remains the largest U.S. retailer by sales, generating $450 billion in the U.S. alone (2023).
Walmart’s U.S. sales account for a significant portion of its total sales, while Amazon continues to be a strong competitor in online retail.
Retail Statistics By Brick and Mortar Stores
Despite the surge of online shopping, brick-and-mortar stores remain vital shopping hubs. Here are some insights about physical retail locations:
-
Dollar General leads the U.S. in store count, operating 17,348 stores as of 2023.
While Walmart is the largest retailer by revenue, Dollar General has the most locations, followed closely by Dollar Tree and CVS.
-
74% of people prefer to shop at physical stores during the holiday season.
Even with the rise of online shopping, many consumers still enjoy the experience of in-person holiday shopping.
-
Physical stores are projected to account for 70% of all U.S. retail sales by 2024.
This indicates that while e-commerce is on the rise, traditional stores will continue to play a significant role in retail.
-
U.S. consumers spent an average of 12% more time and money in brick-and-mortar stores in 2022.
This trend highlights the ongoing consumer desire for tactile shopping experiences.
-
95% of consumers have returned to shopping at physical stores, as of 2023.
This reflects a strong rebound in consumer confidence and preference for in-store shopping experiences.
| Retailer | Number Of Stores | 2023 U.S. Retail Sales (In Billions) |
|---|---|---|
| Dollar General | 17,348 | $33.74 |
| Dollar Tree | 15,375 | $25.08 |
| CVS | 9,813 | $89.53 |
| 7-Eleven | 9,522 | $18.25 |
| Walgreens | 8,760 | $104.70 |
| Alimentation Couche-Tard | 6,784 | $9.95 |
| Verizon Wireless | 6,339 | $15.49 |
| AutoZone | 5,837 | $10.70 |
| O’Reilly Auto Parts | 5,594 | $11.60 |
| Walmart | 5,253 | $450.00 |
Retail Statistics By Consumer Preferences
Understanding consumer preferences is crucial for retailers looking to thrive. Here are some updated insights into what customers want:
-
Gen Z has the highest online shopping preference, with 90% of shoppers favoring it.
As age increases, the preference for online shopping decreases: 70% of Millennials, 59% of Generation X, and 45% of baby boomers prefer shopping online.
-
88% of U.S. consumers begin their shopping journey online with product searches.
An impressive 76% of these searches start on Amazon, making it a dominant platform for consumer research.
-
72% of consumers utilize three or more channels when making a single purchase.
This highlights the importance of multichannel strategies for retailers to meet consumer expectations.
-
63% of customers prefer to try products in-store before purchasing.
Additionally, 67% of consumers choose in-store shopping to avoid delivery fees.
-
58% of consumers expect personalized discounts within a day after sharing their information with a retailer.
Moreover, 34% expect such offers within just an hour, indicating the importance of timely engagement in driving repeat purchases.

Retail Statistics By E-commerce
While e-commerce experienced a surge during the pandemic, it continues to grow in 2023. Here are current insights about this vital sector:
-
U.S. e-commerce revenue grew by approximately 14% from 2022 to 2023.
The e-commerce sector has shown consistent growth, reflecting a broader trend in consumer behavior.
-
There are now about 8 million online retailers operating globally.
Among these, around 2 million online retailers are based in the U.S., representing approximately 25% of the global market.
-
Amazon continues to dominate, accounting for over 50% of U.S. online retail sales as of 2023.
This demonstrates Amazon’s sustained market leadership and the ongoing preference for its platform.

Retail Statistics By Trends
Retail continues to evolve, with trends shaped by consumer preferences and technological advancements. Here are key trends shaping the industry:
-
73% of U.S. consumers now utilize BOPIS (Buy Online, Pick Up In-Store).
This trend emphasizes the blending of online and offline shopping experiences.
-
The share of retailers offering curbside pickup has expanded to 50% since the pandemic.
This significant increase reflects consumer demand for convenience and flexibility in shopping.
-
The U.S. e-commerce market is expected to experience a CAGR of 14% from 2023 to 2025.
Sectors like fashion and personal care are projected to see even higher growth rates.
Retail Industry Statistics FAQ
-
What percentage of the U.S. economy is retail?
5.8% of U.S. GDP is retail. Furthermore, retail accounts for about 25% of total employment in the country, meaning one in four U.S. employees works in this sector.
-
How many retail stores are there in the U.S.?
There are about 1,050,000 brick-and-mortar retail stores across the U.S. Additionally, there are approximately 2 million online retailers operating in the U.S.
-
What store has the most stores?
Dollar General operates the most stores in the United States, with 17,348 locations. Dollar Tree and CVS follow with 15,375 and 9,813 stores, respectively. Walmart, while the largest retailer by sales, ranks 10th by store count with 5,253 locations.
-
Is the retail industry growing or declining?
The retail industry is currently growing. The sector has shown resilience, with steady growth rates despite past challenges. E-commerce has continued to expand, with a 14% revenue increase from 2022 to 2023.
-
What is the future of the retail industry?
The future of retail is hybrid. While online shopping is set to grow, brick-and-mortar stores will remain essential, accounting for 85% of sales as of 2023. Expect to see more innovations like curbside pickup and BOPIS options in the future.
Conclusion
The retail sector remains the foremost employment sector in the U.S., with approximately 1,050,000 brick-and-mortar stores and 2 million online retailers contributing to the economy.
Despite the surge in online shopping, traditional retail continues to thrive, with physical stores representing 85% of sales. Moreover, a staggering 95% of consumers have returned to in-store shopping, showcasing the enduring appeal of physical retail experiences.
As the landscape evolves, the retail industry is expected to grow, demonstrating resilience and adaptability in the face of changing consumer behaviors and technological advancements.
References
-
Statista. “E-commerce as a share of total U.S. retail sales from 1st quarter 2010 to 3rd quarter 2023.” Accessed on February 7th, 2023.
-
Marketplace Pulse. “U.S. Total Retail Growth Rate.” Accessed on February 7th, 2023.
-
NFR. “Retail Sales to Now Exceed $4.8 Trillion in 2023, as NRF Revises Annual Forecast.” Accessed on February 7th, 2023.
-
CareerOneStop. “Industries with Largest Employment.” Accessed on February 7th, 2023.
-
Cision. “28% of Small Businesses Don’t Have a Website, According to New Survey Data.” Accessed on February 7th, 2023.
-
NFR. “Top 100 Retailers 2023 List.” Accessed on February 7th, 2023.
-
Mood Media. “Shopper Sentiments.” Accessed on February 7th, 2023.
-
Statista. “Online shopping preference in the United States as of 2023, by age group.” Accessed on February 8th, 2023.
-
CSA. “Study: Most product searches begin on Amazon.” Accessed on February 8th, 2023.
-
Business News Daily. “Shoppers Still Prefer In-Store Over Online Shopping.” Accessed on February 8th, 2023.
-
Insider. “Shoppers expect more personalization.” Accessed on February 8th, 2023.
-
Statista. “Retail e-commerce revenue in the United States from 2023 to 2025.” Accessed on February 8th, 2023.
-
Digital Intheround. “How Many Online Stores Are There in 2023?” Accessed on February 8th, 2023.
-
Statista. “Projected retail e-commerce GMV share of Amazon in the United States from 2023 onwards.” Accessed on February 8th, 2023.
-
Insider. “Almost 75% of U.S. consumers use BOPIS.” Accessed on February 8th, 2023.
-
HBR. “How “Buy Online, Pick Up In-Store” Gives Retailers an Edge.” Accessed on February 8th, 2023.
-
Statista. “Retail e-commerce sales CAGR in the United States from 2023 to 2025, by product category.” Accessed on February 8th, 2023.
- Industry Statistics
- Wedding Industry Statistics
- Yoga Industry Statistics
- Music Industry Statistics
- Landscaping Industry Statistics
- Bicycle Industry Statistics
- Coffee Industry Statistics
- Car Rental Industry Statistics
- Home Improvement Industry Statistics
- Insurance Industry Statistics
- Supplements Industry Statistics
- Golf Industry Statistics
- Fitness Industry Statistics
- US Media And Entertainment Industry Statistics
- Firearm Industry Statistics
- Financial Services Industry Statistics
- Health And Wellness Industry Statistics
- Trucking Industry Statistics
- Wine Industry Statistics
- Pet Industry Statistics
- Mobile App Industry Statistics
- Digital Marketing Industry Statistics
- Hotel Industry Statistics
- Retail Statistics
- Robotics Industry Statistics
- Jewelry Industry Statistics
- Appointment Scheduling statistics
- Restaurant Industry Statistics
- Food Delivery Statistics
- Food Truck Industry
- Fashion Industry
- Real Estate Industry
- US Film Industry
- US Beverage Industry
- USu202fFast Food Restaurants
- US Construction Industry
- US Book Industry
- Cosmetics Industry
- US Food Retail Industry
- US Pharmaceutical Industry
- US Healthcare Industry
- Airline Industry
- Automobile Industry
- Transportation Industry Statistics
- Event Industry Statistics
- Project Management Statistics
- Oil And Gas Industry Statistics
- Nursing Home Statistics
- Nursing Shortage Statistics
- Nursing Statistics
Author
Jack Flynn is a writer for Zippia. In his professional career he’s written over 100 research papers, articles and blog posts. Some of his most popular published works include his writing about economic terms and research into job classifications. Jack received his BS from Hampshire College.