US Literacy Rate By State [2026]
Literacy Rate Overview. The literacy rate in the United States has significantly improved over the last century, yet disparities persist among states. In this article, we provide the latest statistics and insights into literacy rates across the nation, highlighting the states with the highest and lowest rates. As of 2026:
-
The current national literacy rate is 79%.
-
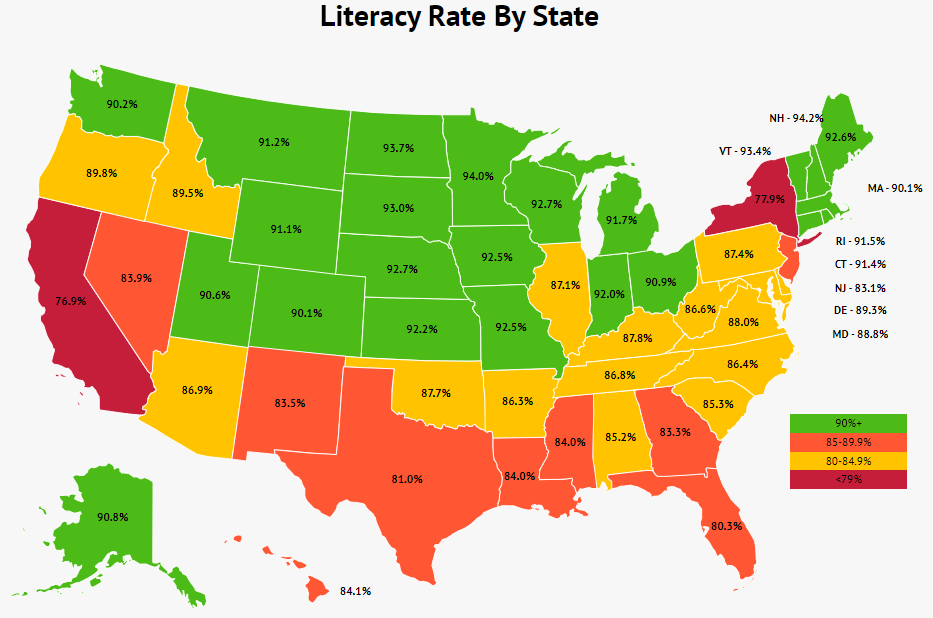
New Hampshire boasts the highest literacy rate at 94.2%.
-
California has the lowest literacy rate, recorded at 76.9%.
-
68% of US 4th graders still perform below the optimal reading level proficiency.
-
Adult illiteracy costs the US economy approximately $2.2 trillion annually.
US Literacy Rate by State
Literacy rates vary significantly from state to state, with some surprising outcomes among the highest and lowest rates. Here’s a detailed breakdown:
Literacy Rate By State
| State | Literacy Rate |
|---|---|
| Alabama | 85.2% |
| Alaska | 90.8% |
| Arizona | 86.9% |
| Arkansas | 86.3% |
| California | 76.9% |
| Colorado | 90.1% |
| Connecticut | 91.4% |
| Delaware | 89.3% |
| Florida | 80.3% |
| Georgia | 83.3% |
| Hawaii | 84.1% |
| Idaho | 89.5% |
| Illinois | 87.1% |
| Indiana | 92.0% |
| Iowa | 92.5% |
| Kansas | 92.2% |
| Kentucky | 87.8% |
| Louisiana | 84.0% |
| Maine | 92.6% |
| Maryland | 88.8% |
| Massachusetts | 90.1% |
| Michigan | 91.7% |
| Minnesota | 94.0% |
| Mississippi | 49.8% |
| Missouri | 84.0% |
| Montana | 91.2% |
| Nebraska | 92.7% |
| Nevada | 83.9% |
| New Hampshire | 94.2% |
| New Jersey | 83.1% |
| New Mexico | 83.5% |
| New York | 77.9% |
| North Carolina | 86.4% |
| North Dakota | 93.7% |
| Ohio | 90.9% |
| Oklahoma | 87.7% |
| Oregon | 89.8% |
| Pennsylvania | 87.4% |
| Rhode Island | 91.5% |
| South Carolina | 85.3% |
| South Dakota | 93.0% |
| Tennessee | 86.8% |
| Texas | 81.0% |
| Utah | 90.6% |
| Vermont | 93.4% |
| Virginia | 88.0% |
| Washington | 90.2% |
| West Virginia | 86.6% |
| Wisconsin | 92.7% |
| Wyoming | 91.1% |
-
New Hampshire has the highest literacy rate in the US, at 94.2%.
The top five states in the US by literacy rate include Minnesota (94.0%), North Dakota (93.7%), Vermont (93.4%), and South Dakota (93.0%).
-
California has the lowest literacy rate in the US, at 76.9%.
The bottom five states in the US by literacy rate include New York (77.9%), Florida (80.3%), Texas (81.0%), and New Jersey (83.1%).
US Literacy Rate by Race, Ethnicity, and Country of Origin
Various factors influence literacy rates, including the diverse backgrounds of Americans. While many immigrants arrive in the US with limited English proficiency, native-born individuals may also face literacy challenges. Here are key insights:
-
35% of Americans with low literacy are White.
Hispanic Americans represent 34% of individuals with low literacy, while Black Americans account for 23%.
Literacy Rate by Race/Ethnicity
Race/Ethnicity Share of Americans with Low Literacy Share of Non-Native Born White 35% 2% Hispanic 34% 24% Black 23% 3% Other 8% N/A -
24% of Hispanic Americans with low literacy rates are not native-born.
For many Hispanic Americans, Spanish is their first language, making the transition to reading English a challenge. In contrast, only 2% of the White population with low literacy are non-native speakers.
-
Immigrants constitute 34% of the total low-literacy population.
Despite making up only 15% of the US population, immigrants are disproportionately represented among those with low literacy, indicating a need for targeted educational support.
-
Among unauthorized US immigrants, those from the Northern Triangle have the lowest average literacy rates at 22%.
This region includes El Salvador, Guatemala, and Honduras, while Mexican immigrants exhibit a literacy rate of 25%. Conversely, immigrants from Asian countries have a higher average literacy rate of 54%.
Literacy Rate by Region of Origin
Region of Origin Average Literacy Rate Northern Triangle 22% Mexico 25% Other Latin American Countries 43% Asia 54% Other Regions 69%
Literacy FAQs
-
What does illiterate mean?
Illiterate refers to the inability to read and write. Individuals who are illiterate may face challenges in reading and writing but this does not reflect their intelligence or spoken language proficiency. Many who struggle with English literacy can still communicate effectively.
-
What percentage of America is illiterate?
21% of Americans are classified as illiterate. The US ranks lower than many countries in terms of overall literacy, with 54% of adults reading below a sixth-grade level.
By ethnicity, 35% of White Americans, 34% of Hispanic Americans, and 23% of Black Americans experience low literacy.
-
What is functional illiteracy?
Functional illiteracy describes individuals who can read and write at a basic level but lack the skills necessary for most jobs and daily activities. Despite basic skills, they may struggle with tasks that require reading complex texts or using advanced tools, contributing to the economic burden of low literacy, estimated at $2.2 trillion per year.
-
What state has the highest child literacy rate?
Massachusetts leads with the highest child literacy rate at 80%. Young children typically acquire literacy skills more easily, making high child literacy rates crucial. In contrast, New Mexico has the lowest child literacy rate in the US, at just 30%.
-
What city in the US has the highest illiteracy rate?
Washington, D.C. has the highest literacy rate in the US. Other cities with high literacy rates include Seattle, WA and Minneapolis, MN.
Conversely, cities with the lowest literacy rates include El Paso, TX, Bakersfield, CA, and Laredo, TX.
Conclusion
The literacy rate is a crucial yet frequently overlooked aspect of the US economy. As of 2026, the nationwide literacy rate stands at around 79%, with the absence of literacy imposing an estimated annual cost of $2.2 trillion on the economy.
Disparities exist across states and demographics. New Hampshire boasts the highest literacy rate, while California has the lowest. Notably, 35% of illiterate Americans are White, with Hispanic Americans closely following at 34%.
Interestingly, only 2% of illiterate White Americans are non-native speakers, compared to 24% of illiterate Hispanics. This highlights the challenges within the American education system affecting literacy rates, particularly among native-born individuals.
References
-
World Population Review – U.S. Literacy Rates by State [Updated May 2023]
-
Readability Matters – Forbes reports Low Literacy Levels Among U.S. Adults Could Be Costing The Economy $2.2 Trillion A Year
Author
Jack Flynn is a writer for Zippia. In his professional career he’s written over 100 research papers, articles and blog posts. Some of his most popular published works include his writing about economic terms and research into job classifications. Jack received his BS from Hampshire College.