Find a Job You Really Want In
While the U.S. population continues to grow, the distribution of that growth varies significantly across the country. Some states are experiencing a population surge, while others are facing declines. In 2026, the factors influencing migration patterns have evolved, with changing economic landscapes, remote work dynamics, and shifting quality of life priorities playing crucial roles in where Americans choose to live.
State-to-state migration now accounts for a significant part of population changes, with economic opportunities and job markets acting as major magnets for residents. Conversely, states with stagnant or declining economies are grappling with the repercussions of outmigration, including loss of talent and tax revenue. Below, we explore the states from which many Americans are departing and where they are heading instead.
The 10 States With The Largest Population Decrease
This list reveals a notable trend: many Northeastern states are struggling with population decline. For a deeper understanding, continue reading for insights into the ten least popular states and their migration patterns.
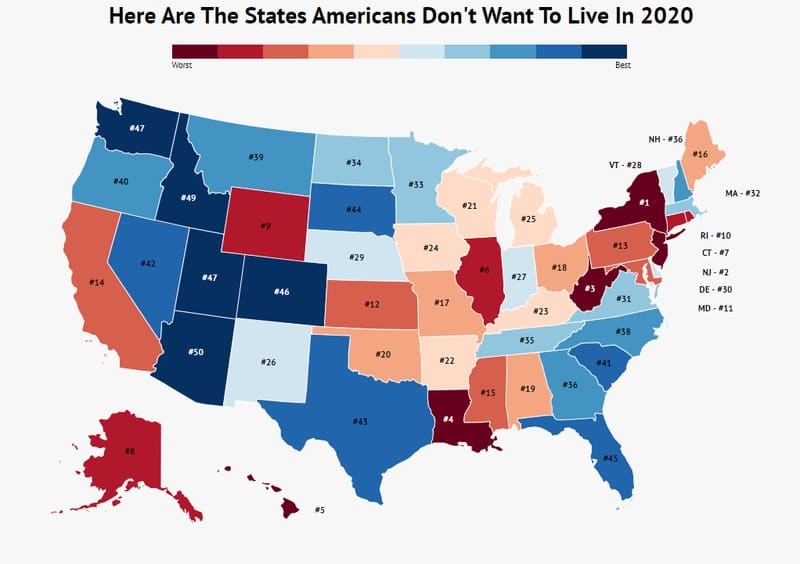
How We Determined The States Americans Don’t Want To Live In 2026
Our analysis utilized the latest population data from the Census Bureau. We calculated the population changes from 2020 to 2025, focusing on the percentage of increase or decrease. This method accounts for the impact of population shifts, especially when large states lose residents compared to smaller states.
1. New York

Population lost: -307,190
Population decrease: -1.57%
Where are they relocating: New Jersey, Pennsylvania, Florida, California, Connecticut, North Carolina
New York, New York remains a cultural and economic powerhouse, yet high living costs have driven nearly 2% of its population to seek more affordable living conditions elsewhere.
2. New Jersey

Population lost: -97,124
Population decrease: -1.09%
Where are they relocating: Pennsylvania, New York, Florida, North Carolina, California
New Jersey continues to experience one of the highest rates of outmigration in the country. Despite its proximity to New York City, the high cost of living, coupled with burdensome taxes, prompts many residents to relocate in search of better opportunities and affordability.
3. West Virginia

Population lost: -10,025
Population decrease: -0.56%
Where are they relocating: Ohio, Florida, Pennsylvania, Maryland, North Carolina
West Virginia has faced economic challenges, resulting in a gradual population decline. A lack of job opportunities, particularly for younger demographics, has driven many residents to seek employment in neighboring states.
4. Louisiana

Population lost: -24,355
Population decrease: -0.52%
Where are they relocating: Texas, Mississippi, California, Florida, Georgia
Despite the end of the recession, Louisiana continues to struggle with economic stagnation, leading many residents to pursue better job prospects in states like Texas and Florida.
5. Hawaii

Population lost: -7,047
Population decrease: -0.50%
Where are they relocating: California, Texas, Nevada, North Carolina
Hawaii’s beauty is undeniable, but the high cost of living is prompting many locals to seek more affordable lifestyles in other states.
6. Illinois

Population lost: -60,943
Population decrease: -0.48%
Where are they relocating: Indiana, Florida, Wisconsin, California, Missouri
Illinois has witnessed a persistent outflow of residents, driven by high taxes and a challenging economic environment, prompting many to relocate to states with more favorable conditions.
7. Connecticut

Population lost: -15,519
Population decrease: -0.43%
Where are they relocating: Florida, New York, Massachusetts, South Carolina, California
Connecticut’s aging population and low birth rates contribute to its population decline, with many seeking warmer climates and lower taxes in states like Florida.
8. Alaska

Population lost: -2,357
Population decrease: -0.32%
Where are they relocating: Oregon, Washington, Arizona, Texas, California
Despite its vast land, Alaska’s population has been gradually declining, with many residents seeking better economic opportunities in the Pacific Northwest.
9. Wyoming

Population lost: -1,578
Population decrease: -0.27%
Where are they relocating: Texas, Colorado, Montana, Utah, California
Wyoming faces challenges in attracting and retaining residents, while neighboring states like Idaho are experiencing significant growth.
10. Rhode Island

Population lost: -2,324
Population decrease: -0.22%
Where are they relocating: Massachusetts, Florida, Connecticut, Virginia, California
Rhode Island continues to see small declines in population, reflecting broader trends in the Northeast, where residents are seeking better economic opportunities elsewhere.
Closing Thoughts On The States With The Largest Population Decrease
The ten states listed above have experienced the most significant population declines. The trend of moving toward neighboring states remains evident, as many individuals seek proximity to family and friends while pursuing improved quality of life and economic opportunities. The reasons behind these migrations are complex and multifaceted, reflecting the evolving needs and priorities of American workers. To see a complete list of all 50 states and their population growth rates, continue reading below.
Fastest Growing States
Need more specific or expanded data for a story you’re writing? Email kmorris@zippia.com
The States Americans Want To Live In The Least (And The Most)
| Rank | State | Population Change | % |
|---|---|---|---|
| 1 | New York | -307,190 | -1.57% |
| 2 | New Jersey | -97,124 | -1.09% |
| 3 | West Virginia | -10,025 | -0.56% |
| 4 | Louisiana | -24,355 | -0.52% |
| 5 | Hawaii | -7,047 | -0.50% |
| 6 | Illinois | -60,943 | -0.48% |
| 7 | Connecticut | -15,519 | -0.43% |
| 8 | Alaska | -2,357 | -0.32% |
| 9 | Wyoming | -1,578 | -0.27% |
| 10 | Rhode Island | -2,324 | -0.22% |
| 11 | Maryland | -9,459 | -0.16% |
| 12 | Kansas | -1,613 | -0.06% |
| 13 | Pennsylvania | 1,523 | 0.01% |
| 14 | California | 20,392 | 0.05% |
| 15 | Mississippi | 2,430 | 0.08% |
| 16 | Maine | 2,497 | 0.19% |
| 17 | Missouri | 12,920 | 0.21% |
| 18 | Ohio | 30,833 | 0.26% |
| 19 | Alabama | 13,124 | 0.27% |
| 20 | Oklahoma | 12,215 | 0.31% |
| 21 | Wisconsin | 18,085 | 0.31% |
| 22 | Arkansas | 9,546 | 0.32% |
| 23 | Kentucky | 14,213 | 0.32% |
| 24 | Iowa | 10,434 | 0.33% |
| 25 | Michigan | 33,604 | 0.34% |
| 26 | New Mexico | 7,358 | 0.35% |
| 27 | Indiana | 25,060 | 0.37% |
| 28 | Vermont | 2,642 | 0.42% |
| 29 | Nebraska | 9,192 | 0.48% |
| 30 | Delaware | 5,232 | 0.54% |
| 31 | Virginia | 47,665 | 0.56% |
| 32 | Massachusetts | 42,330 | 0.61% |
| 33 | Minnesota | 34,573 | 0.62% |
| 34 | North Dakota | 4,684 | 0.62% |
| 35 | Tennessee | 54,026 | 0.80% |
| 36 | Georgia | 90,096 | 0.86% |
| 36 | New Hampshire | 13,663 | 1.01% |
| 38 | North Carolina | 110,201 | 1.06% |
| 39 | Montana | 11,812 | 1.11% |
| 40 | Oregon | 47,937 | 1.14% |
| 41 | South Carolina | 59,758 | 1.18% |
| 42 | Nevada | 36,353 | 1.20% |
| 43 | Texas | 397,249 | 1.38% |
| 44 | South Dakota | 12,569 | 1.42% |
| 45 | Florida | 314,925 | 1.48% |
| 46 | Colorado | 88,410 | 1.55% |
| 47 | Washington | 129,848 | 1.72% |
| 48 | Utah | 59,272 | 1.88% |
| 49 | Idaho | 37,265 | 2.12% |
| 50 | Arizona | 155,376 | 2.17% |
Now Try Zippia’s Job Search
Author
Kathy is the head of content at Zippia with a knack for engaging audiences. Prior to joining Zippia, Kathy worked at Gateway Blend growing audiences across diverse brands. She graduated from Troy University with a degree in Social Science Education.