35+ Encouraging Women-Owned Business and Entrepreneurship Statistics [2026]
Research Summary. Over the past two decades, women-owned businesses have proliferated, becoming increasingly profitable and playing a vital role in the economy. This article explores the evolution of women-owned businesses and their current market presence in 2026.
-
42% of small businesses are owned by women in the United States.
-
An average of 1,821 new businesses start per day by women.
-
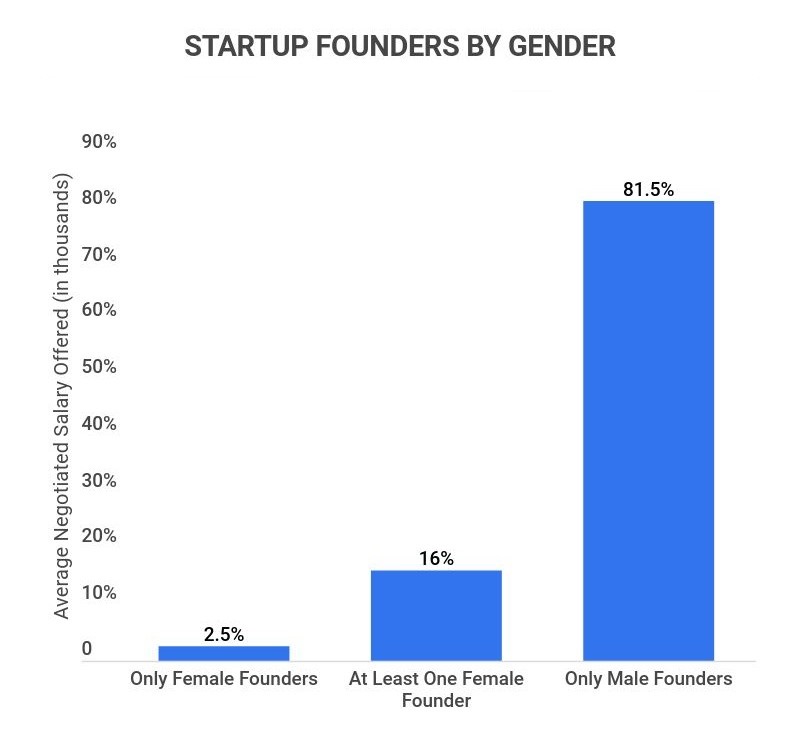
16% of startups in the United States feature at least one female founder.
-
There has been a 114% increase in the number of female entrepreneurs over the last 20 years.
-
Women-owned businesses generate an average of $1.8 trillion per year.
-
47% of female-owned businesses are led by women of color.
-
The number of women-owned small businesses increased by 58% from 2007 to 2018.
-
90.3% of women operate micro-businesses (compared to 82.3% of men).
For further analysis, we broke down the data in the following ways:
Entrepreneur | Entrepreneurs and Business Owners | Location | Obstacles
Women Small Business Statistics
-
In 2022, women started a total of approximately 663,205 businesses.
On average, there are 1,821 businesses founded by women every single day in the United States, a significant increase from previous years.
-
As of 2022, there are 12,943,400 businesses owned by women.
This number has consistently risen over the past 50 years, showcasing the growing acceptance of female entrepreneurship.
-
42% of all businesses are owned by women as of 2022.
This statistic reflects substantial progress toward gender equality in the business world.
-
9.4 million people are employed by women-owned businesses.
This figure indicates an 8% growth in employment opportunities provided by female entrepreneurs.
-
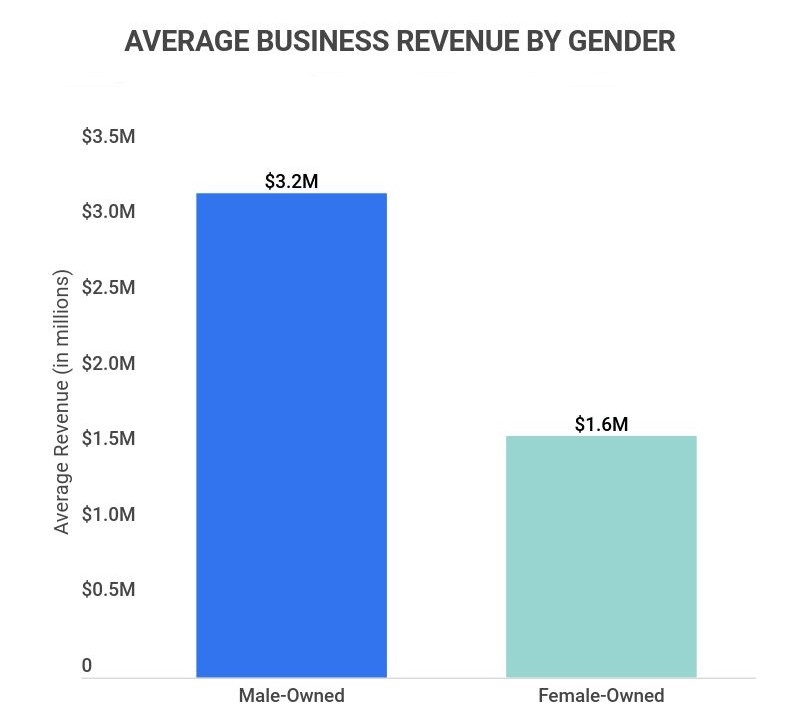
Women-owned businesses each earned an average revenue of $1.6 million as of 2022.
Although this is a notable sum, it remains below the average revenue of $3.2 million for male-owned businesses.
-
As of 2022, 7.4% of Fortune 500 CEOs are women.
This marks a significant improvement in women’s representation in corporate leadership roles.
Women Entrepreneur Statistics
-
As of 2022, 2.3% of venture capital funding was allocated to women-led startups.
-
16% of startups in the United States have at least one female founder.
Of the $83 billion invested in venture-backed startups, only 2.5% went to those with solely female founders.
-
Industries where female founders thrive include healthcare, social assistance, professional services, and beauty.
The ‘other services’ category encompasses 22% of women-owned businesses with approximately 2.8 million firms.
-
The number of women entrepreneurs in the United States has surged by over 30% since 2007.
These businesses have generated approximately 5 million jobs in total.
-
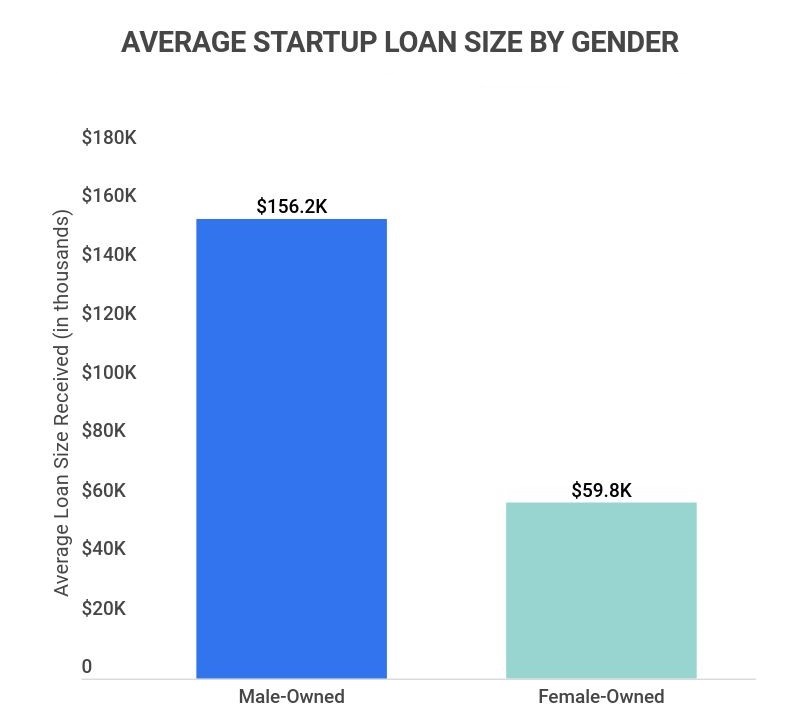
On average, women receive a loan size of $59,857 to start their businesses.
This amount is significantly lower than the $156,279 received by male counterparts, complicating growth for women-owned businesses.
-
Only about 25% of entrepreneurs seeking funding are women.
This statistic underscores the challenges faced by female entrepreneurs in accessing financial resources.
-
Around 32% of women who apply for business funding are approved for credit.
This approval rate is only slightly lower than the 35% for male entrepreneurs.
-
Women received only 7% of the venture capital raised in the U.S. between 2010 and 2015.
This indicates a substantial disparity in funding opportunities for female entrepreneurs.
-
From 2009 to 2019, 15,105 startups were funded with at least one female founder.
In 2019, female-founded startups represented 20% of all new companies, a significant increase from less than 10% in 2009.
Women of Color Entrepreneurs and Business Owners Statistics Over Time
-
As of 2022, women of color own 50% of female-led businesses.
This number represents 6,417,400 businesses in the U.S., highlighting the need for more equitable representation and revenue generation.
-
From 2007 to 2018, businesses owned by women of color increased by 163%.
This growth is particularly significant among African American/Black and Latina/Hispanic women.
-
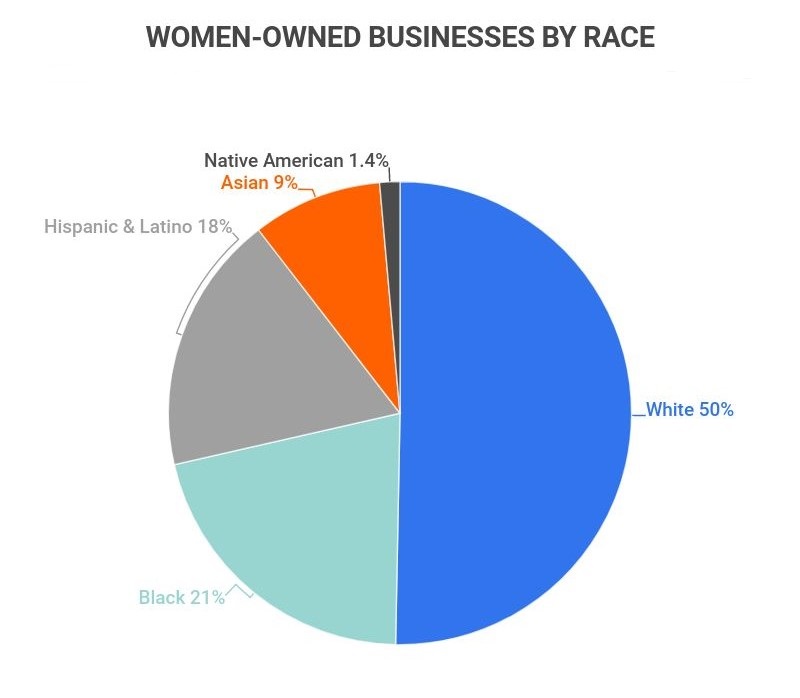
African American/Black female-owned businesses accounted for 21% of all women-owned businesses.
This figure represents 2,681,200 businesses with an average annual revenue of $24,000, significantly lower than the average of $142,900 among all women-owned businesses.
-
Latina/Hispanic women own 18% of all women-owned businesses.
This equates to 2,346,200 businesses, each earning an average of $50,900 annually.
-
Asian American women-owned businesses constitute 9% of all female-run businesses.
These firms account for 1,169,300 businesses, generating an average of $191,200 annually.
-
Native American/Alaskan Native female-run businesses represent 1.4% of all female-owned businesses.
This percentage corresponds to 180,300 businesses with average earnings of $68,500 annually.
-
Native Hawaiian/Pacific Islander women-owned businesses account for 0.3% of all female-run businesses.
There are 40,400 businesses in this category, each generating an average revenue of $69,500.
Women Entrepreneurs and Business Owner Location Statistics
-
The states with the most women-owned businesses, employment, and revenue are Georgia, Oregon, Idaho, Nevada, and South Dakota.
-
The cities with the most women-owned businesses, employment, and revenue include Detroit, Charlotte, Atlanta, Austin, and San Antonio.
-
The states with the least women-owned businesses, employment, and revenue are Louisiana, Oklahoma, Nebraska, Alaska, and North Dakota.
-
The cities with the least women-owned businesses, employment, and revenue are St. Louis, Hartford, Milwaukee, Boston, and Providence.
Obstacles Women Face When Starting a Business
-
Women-led startups received only 2.3% of venture capital funding as of 2020.
Funding continues to be a major challenge for women entrepreneurs, impacting their ability to launch and scale businesses.
-
In the 1970s, women owned less than 5% of businesses in the U.S.
Societal expectations have historically limited women’s participation in entrepreneurship, a trend that has slowly begun to change.
-
Women of color only account for 50% of female-owned businesses.
This highlights the ongoing challenges faced by women of color in the entrepreneurial landscape, including disparities in revenue.
-
Until 1988, women could not independently secure business loans without a male co-signer.
This historical limitation has long affected women’s access to capital and their entrepreneurial ambitions.
Female Entrepreneurship and Women-Owned Businesses FAQ
-
What proportion of businesses in the United States are owned by women?
42% of all businesses in the United States are owned by women. This represents significant progress in market representation over the past 20 years.
-
How many people work for women-owned businesses?
Approximately 9.4 million people are employed at the nearly 13 million businesses owned by women. Employment opportunities have expanded significantly in recent years.
-
What percentage of female-owned businesses are run by women of color?
Nearly 50% of female-owned businesses are led by women of color. This indicates the need for continued focus on inclusivity and diversity in entrepreneurship.
-
What is ‘economic clout’?
Economic clout is a metric used to rank geographic locations based on the growth rates of women-owned businesses. This includes the number of businesses, employment, and revenue generated.
-
Are we living in a better time for women to start a business or become an entrepreneur?
Yes, but complacency is not an option. The landscape for women in business has improved significantly, yet challenges persist.
-
What percentage of businesses are started by women?
16% of businesses are started by women. This statistic reflects ongoing progress in female entrepreneurship despite historical disparities.
-
Are women entrepreneurs more successful than men?
No, women entrepreneurs aren’t more successful than men. However, definitions of success can vary, and revenue alone does not determine entrepreneurial effectiveness.
-
What percent of CEOs are female?
7.4% of Fortune 500 CEOs are female. Women also hold only 8.2% of leadership positions in Fortune 500 companies.
Conclusion
The landscape for female entrepreneurs has undeniably improved. Over the last 50 years, women-run businesses have surged, now accounting for over 42% of all companies in the United States.
Significant legislative changes, such as the Women’s Business Ownership Act of 1988, have paved the way for greater access to capital and fewer restrictions on women entrepreneurs.
While the increase of 114% in female entrepreneurs over the past two decades is encouraging, challenges remain. Women still receive 2.5 times less funding than their male counterparts, and women of color face additional hurdles in the entrepreneurial ecosystem.
Overall, while progress is evident in the statistics surrounding women-owned businesses, ongoing efforts are essential to ensure equitable opportunities and support for all female entrepreneurs.
References
-
American Express PDF Report. “The 2019 State of Women-Owned Businesses Report”. Accessed on August 12, 2021
-
www.census.gov. “Women Business Ownership in America on the Rise”. Accessed on August 12, 2021
-
www.score.org. “The State of Women Entrepreneurs”. Accessed on August 12, 2021
-
www.startupusa.org. “The Ascent of Women-Founded Venture-Backed Startups in the United States”. Accessed on August 12, 2021
-
www.legaljobs.io. https://legaljobs.io/blog/women-entrepreneurs-statistics/. Accessed on August 12, 2021
-
American Express PDF Report. “The 2018 State of Women-Owned Businesses Report”. Accessed on August 12, 2021
-
www.wbenc.org. “Behind the Numbers: The State of Women-Owned Businesses in 2018”. Accessed on August 12, 2021
-
www.cdn.advocacy.sba.gov. “Small Business Facts: Spotlight on Women-Owned Employer Businesses”. August 12, 2021
-
www.nawbo.org. “Women Business Owner Statistics”. Accessed on August 12, 2021
-
www.pewresearch.org. “Women CEOs in Fortune 500 Companies, 1995-2020”. Accessed on August 12, 2021
-
www.hbr.org. “Women-Led Startups Received Just 2.3% of VC Funding in 2020”. Accessed on August 12, 2021
-
www.forbes.com. ‘The Current Rise of Women Entrepreneurial Leaders”. Accessed on August 12, 2021
-
www.fundera.com. “State of Small Business Lending: Spotlight on Women Entrepreneurs”. Accessed on August 12, 2021
-
www.news.crunchbase.com. “EoY 2019 Diversity Report: 20 Percent Of Newly Funded Startups In 2019 Have A Female Founder”. Accessed on August 12, 2021
-
www.smallbiztrends.com. “The History of Women Entrepreneurs (INFOGRAPHIC)”. Accessed on August 12, 2021
Author
Sky Ariella is a professional freelance writer, originally from New York. She has been featured on websites and online magazines covering topics in career, travel, and lifestyle. She received her BA in psychology from Hunter College.