- Industry Statistics
- Wedding Industry Statistics
- Yoga Industry Statistics
- Music Industry Statistics
- Landscaping Industry Statistics
- Bicycle Industry Statistics
- Coffee Industry Statistics
- Car Rental Industry Statistics
- Home Improvement Industry Statistics
- Insurance Industry Statistics
- Supplements Industry Statistics
- Golf Industry Statistics
- Fitness Industry Statistics
- US Media And Entertainment Industry Statistics
- Firearm Industry Statistics
- Financial Services Industry Statistics
- Health And Wellness Industry Statistics
- Trucking Industry Statistics
- Wine Industry Statistics
- Pet Industry Statistics
- Mobile App Industry Statistics
- Digital Marketing Industry Statistics
- Hotel Industry Statistics
- Retail Statistics
- Robotics Industry Statistics
- Jewelry Industry Statistics
- Appointment Scheduling statistics
- Restaurant Industry Statistics
- Food Delivery Statistics
- Food Truck Industry
- Fashion Industry
- Real Estate Industry
- US Film Industry
- US Beverage Industry
- USu202fFast Food Restaurants
- US Construction Industry
- US Book Industry
- Cosmetics Industry
- US Food Retail Industry
- US Pharmaceutical Industry
- US Healthcare Industry
- Airline Industry
- Automobile Industry
- Transportation Industry Statistics
- Event Industry Statistics
- Project Management Statistics
- Oil And Gas Industry Statistics
- Nursing Home Statistics
- Nursing Shortage Statistics
- Nursing Statistics
Fast food industry overview. Fast food refers to mass-produced food items designed for quick service and commercial resale. Originally developed to meet the needs of busy commuters and workers, the fast food industry has evolved significantly. Our research team has uncovered key insights:
-
The United States boasts 201,865 fast food restaurant businesses as of 2026.
-
The market size of the US fast food industry reached $331.41 billion as of 2022.
-
The US fast food industry’s compound annual growth rate (CAGR) is projected at 5.1% from 2020 to 2027.
-
Globally, the fast food industry is valued at $907 billion as of 2023.
-
37% or 50 million Americans consume fast food daily.
For more detailed insights, we have categorized the data in the following sections:
Restaurants | Impact of COVID-19 | Health Considerations | Trends and Predictions
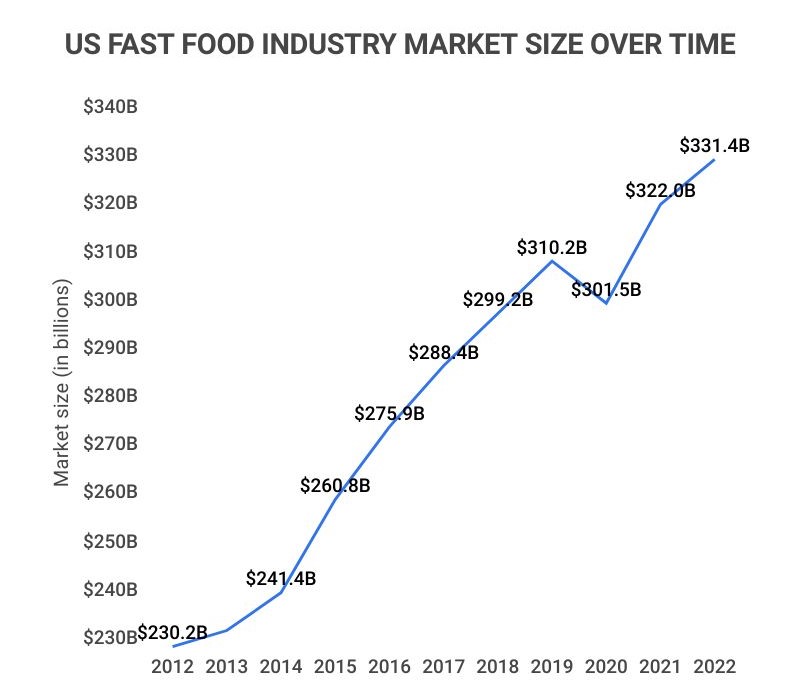
US fast food industry market size over time
| Year | Market Size |
|---|---|
| 2022 | $331.41B |
| 2021 | $322.05B |
| 2020 | $301.49B |
| 2019 | $310.21B |
| 2018 | $299.16B |
| 2017 | $288.38B |
| 2016 | $275.99B |
| 2015 | $260.79B |
| 2014 | $241.43B |
| 2013 | $233.70B |
| 2012 | $230.25B |
General Statistics of the Fast Food Industry
The fast food restaurant industry has long been a powerhouse in the United States. On any given day, about 36.6% or 84.4 million adults indulge in fast food.
This enduring popularity fuels continuous growth in the sector. Consider these key statistics:
-
As of 2022, the US fast food industry is valued at $331.41 billion.
That’s over a quarter trillion in annual revenue, maintaining a steady growth of approximately 1.1% for decades. For context, in 2000, the fast food market was worth $239.2 billion.
-
In 2023, there were 785,316 franchise owners in the US fast food sector.
Franchising enables rapid expansion without heavy reliance on borrowed capital, benefiting franchise owners through national marketing campaigns and operational resources.
-
Meal prices typically range from $5 to $7 at fast food restaurants, though prices have increased by an average of 6% since 2020.
On average, an individual spends about $1,200 annually on fast food, with households allocating around 10% of their income to this segment each year.
-
In 2021, the global fast food industry generated $797.7 billion in revenue.
While the US dominates the market, contributing 37% of global fast food revenue, other countries also experience significant fast food growth.
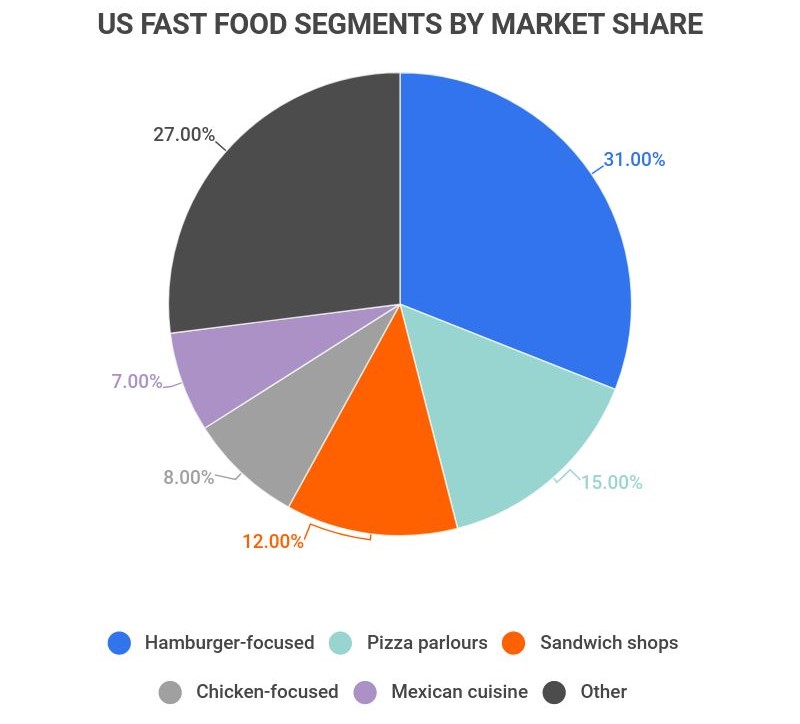
Fast Food Restaurant Statistics
Fast food restaurants are ubiquitous across the United States, often located in standalone buildings, shopping centers, malls, or along highways. Here are some statistics that highlight the scale of this industry:
-
Hamburger-centric fast food chains account for 31% of the fast food market.
When fast food comes to mind, hamburgers typically top the list, affirming the significance of establishments like McDonald’s and Burger King, which dominate the landscape. Pizza and sandwiches follow as popular offerings.
-
Subway leads as the largest franchised fast food chain in the US, with 20,622 locations nationwide.
The chain’s annual sales in the US reach $10.4 billion, with California housing the most Subway locations at 2,014 (10% of the total).
-
Subway ranks first in the number of franchised stores, followed by Starbucks and McDonald’s.
Starbucks and Dunkin’ hold the second and fourth positions, respectively, while McDonald’s ranks third based on franchise count.
-
The fast food sector employs approximately 3,450,120 individuals across the United States.
The average hourly wage for fast food employees is $11.80, translating to an annual mean salary of $24,540.
-
Alabama boasts the highest concentration of fast food restaurants, with 6.3 per 10,000 residents.
Nebraska and West Virginia follow closely behind with 5.4 and 5.3 restaurants per capita, respectively. Vermont ranks lowest with only 1.9 fast food establishments per 10,000 residents.
Fast Food Companies Ranked by Number of Locations
| Company | Total Locations |
|---|---|
| Subway | 20,622 |
| Starbucks | 15,866 |
| McDonald’s | 13,438 |
| Dunkin’ | 9,368 |
| Taco Bell | 7,772 |
| Burger King | 7,257 |
| Pizza Hut | 6,850 |
| Domino’s | 6,696 |
| Wendy’s | 5,984 |
| Dairy Queen | 4,341 |
States with the Most Fast Food Restaurants per Capita
| State | Restaurants Per Capita |
|---|---|
| Alabama | 6.3 |
| Nebraska | 5.4 |
| West Virginia | 5.3 |
| Oklahoma | 5.3 |
| Tennessee | 5.2 |
States with the Least Fast Food Restaurants per Capita
| State | Restaurants Per Capita |
|---|---|
| Vermont | 1.9 |
| New Jersey | 2.0 |
| New York | 2.1 |
| Mississippi | 2.1 |
| Connecticut | 2.4 |
Impact of COVID-19 on the Fast Food Industry
The COVID-19 pandemic significantly reshaped the fast food industry. With social distancing measures and health protocols in place, restaurants adapted quickly to maintain operations.
Fast food establishments that offered delivery and drive-thru services gained a competitive edge over those that relied solely on dine-in options.
-
While restaurant foot traffic plummeted, online orders for pickup and delivery surged by almost 12% on weekdays.
Take-out became more popular on weekends, whereas online orders predominantly occurred during weekdays. Dinner orders increased by 3%, while lunch orders grew by 18%.
-
Foot traffic to fast food and casual dining restaurants fell by 45% and 67%, respectively, since the onset of lockdowns.
This decline prompted fast food businesses to rethink their staffing strategies, prioritizing delivery and drive-thru services.
Health Statistics in the Fast Food Industry
Fast food has long faced scrutiny regarding its health implications, despite its convenience. Many fast food chains have initiated advertising campaigns to improve public perception and promote healthier menu options.
-
The average adult consumes 836 calories per fast food meal, often underestimating their intake by 175 calories.
Generally, a healthy meal for an adult should ideally contain 500 calories or less. Many fast food outlets now provide healthier alternatives and nutritional information.
-
Over the past two decades, portion sizes have increased significantly, with hamburgers growing by 23% and soft drinks by 52%.
Mexican food portions are now 27% larger, while snacks have grown by 60%.
Trends and Predictions in the Fast Food Industry
The fast food industry shows no signs of slowing down, with consistent growth projected for the future. Here are some key trends:
-
The US fast food market has expanded by an average of 1.1% annually from 2016 to 2021.
It’s anticipated that the market size will increase by 8.9% in 2021 alone. The global fast food market, valued at $647.7 billion in 2019, is expected to reach $931.7 billion by 2027, with a CAGR of 5.1% from 2020 to 2027.
-
The index for food consumed away from home rose by 5.8% from 2020 to 2021.
This surge represents the largest single-year increase since 1982, highlighting the pent-up demand for dining out as pandemic restrictions eased.
Fast Food Industry FAQ
-
How big is the fast food industry in the US?
The fast food industry in the U.S. is substantial, valued at $331.41 billion. It ranks as the second-largest segment in the accommodation and food services industry by market size and the 35th largest industry in the US overall.
-
How many fast food restaurants are in the US in 2026?
As of 2026, there are 201,865 fast food restaurant businesses in the US. This indicates an increase of 2.55% from 2023.
-
What is the number one fast food chain in the US?
Depending on the criteria, either Subway or McDonald’s holds the title of the number one fast food chain in the US. Subway leads by the number of franchised locations, while McDonald’s tops the charts in average sales per unit.
-
How fast is the US fast food industry growing?
The US fast food industry is growing at an average annual rate of 2.4%. The expected compound annual growth rate from 2020 to 2027 is 4.6%.
Conclusion
The fast food industry has evolved significantly since its inception, becoming a staple in American culture and providing numerous employment opportunities. The convenience of quick preparation and service sets fast food apart in the restaurant sector.
As the largest fast food market globally, the US has fast food chains operating in over 100 countries. Despite ongoing health concerns and rising prices, Americans continue to embrace fast food, indicating a robust industry poised for continued growth.
References
-
IBIS World. “Fast Food Restaurants in the US – Market Size 2002-2027.” Accessed on September 6, 2021.
-
Statista. “Number of franchise establishments in the United States from 2007 to 2020.” Accessed on September 6, 2021.
-
Hubworks. “Statistics About America’s Biggest Fast Food Chains.” Accessed on September 6, 2021.
-
Datafiniti. “Ranking Cities With the Most and Least Fast Food Restaurants.” Accessed on September 6, 2021.
-
Eat This, Not That. “These 4 Fast Food Chains Have Raised Their Prices the Most.” Accessed on September 6, 2021.
-
Mashed. “The Truth About How Many Burgers McDonald’s Has Sold.” Accessed on September 6, 2021.
-
MiQ. “The impact of COVID-19 on eating, restaurants and fast food chains.” Accessed on September 6, 2021.
-
HelpGuide. “Healthy Fast Food.” Accessed on September 6, 2021.
-
ABC News. “Food Portion Sizes Have Grown — A Lot.” Accessed on September 6, 2021.
-
MarketWatch. “Fast Food Market Size Projected To Record $931.7 Billion By 2027: At 4.6% CAGR.” Accessed on September 6, 2021.
-
Barbeque Lab. “Fast Food Statistics (Updated January 2021).” Accessed on September 7, 2021.
-
ScrapeHero. “Number of Subway locations in the United States in 2021.” Accessed on September 7, 2021.
-
U.S. Bureau of Labor Statistics. “Occupational Employment and Wages, May 2020.” Accessed on September 7, 2021.
-
Franchise Help. Fast Food Industry Analysis 2020 – Cost Trends. Accessed on December 12, 2021.
-
IbisWorld. Fast Food Restaurants in the US. Accessed on December 12, 2021.
-
QSR Magazine. Ranking The Top 50 Fast-Food Chains in America. Accessed on December 12, 2021.
-
Bureau of Labor Statistics. Consumer Price Index Summary. Accessed on December 12, 2021.
- Industry Statistics
- Wedding Industry Statistics
- Yoga Industry Statistics
- Music Industry Statistics
- Landscaping Industry Statistics
- Bicycle Industry Statistics
- Coffee Industry Statistics
- Car Rental Industry Statistics
- Home Improvement Industry Statistics
- Insurance Industry Statistics
- Supplements Industry Statistics
- Golf Industry Statistics
- Fitness Industry Statistics
- US Media And Entertainment Industry Statistics
- Firearm Industry Statistics
- Financial Services Industry Statistics
- Health And Wellness Industry Statistics
- Trucking Industry Statistics
- Wine Industry Statistics
- Pet Industry Statistics
- Mobile App Industry Statistics
- Digital Marketing Industry Statistics
- Hotel Industry Statistics
- Retail Statistics
- Robotics Industry Statistics
- Jewelry Industry Statistics
- Appointment Scheduling statistics
- Restaurant Industry Statistics
- Food Delivery Statistics
- Food Truck Industry
- Fashion Industry
- Real Estate Industry
- US Film Industry
- US Beverage Industry
- USu202fFast Food Restaurants
- US Construction Industry
- US Book Industry
- Cosmetics Industry
- US Food Retail Industry
- US Pharmaceutical Industry
- US Healthcare Industry
- Airline Industry
- Automobile Industry
- Transportation Industry Statistics
- Event Industry Statistics
- Project Management Statistics
- Oil And Gas Industry Statistics
- Nursing Home Statistics
- Nursing Shortage Statistics
- Nursing Statistics
Author
Chris Kolmar is a co-founder of Zippia and the editor-in-chief of the Zippia career advice blog. He has hired over 50 people in his career, been hired five times, and wants to help you land your next job. His research has been featured on the New York Times, Thrillist, VOX, The Atlantic, and a host of local news. More recently, he's been quoted on USA Today, BusinessInsider, and CNBC.