- Industry Statistics
- Wedding Industry Statistics
- Yoga Industry Statistics
- Music Industry Statistics
- Landscaping Industry Statistics
- Bicycle Industry Statistics
- Coffee Industry Statistics
- Car Rental Industry Statistics
- Home Improvement Industry Statistics
- Insurance Industry Statistics
- Supplements Industry Statistics
- Golf Industry Statistics
- Fitness Industry Statistics
- US Media And Entertainment Industry Statistics
- Firearm Industry Statistics
- Financial Services Industry Statistics
- Health And Wellness Industry Statistics
- Trucking Industry Statistics
- Wine Industry Statistics
- Pet Industry Statistics
- Mobile App Industry Statistics
- Digital Marketing Industry Statistics
- Hotel Industry Statistics
- Retail Statistics
- Robotics Industry Statistics
- Jewelry Industry Statistics
- Appointment Scheduling statistics
- Restaurant Industry Statistics
- Food Delivery Statistics
- Food Truck Industry
- Fashion Industry
- Real Estate Industry
- US Film Industry
- US Beverage Industry
- USu202fFast Food Restaurants
- US Construction Industry
- US Book Industry
- Cosmetics Industry
- US Food Retail Industry
- US Pharmaceutical Industry
- US Healthcare Industry
- Airline Industry
- Automobile Industry
- Transportation Industry Statistics
- Event Industry Statistics
- Project Management Statistics
- Oil And Gas Industry Statistics
- Nursing Home Statistics
- Nursing Shortage Statistics
- Nursing Statistics
Research Summary. The U.S. beverage industry, encompassing both alcoholic and non-alcoholic drinks, is a powerhouse that generates billions annually. This article reveals the latest trends, facts, and statistics surrounding this dynamic sector as of 2026.
-
The non-alcoholic beverage industry in the United States is valued at approximately $760 billion as of late 2022.
-
In 2022, non-alcoholic drink revenue in the U.S. reached $447.38 billion.
-
American adults consume an average of 341.1 drink calories daily, while children average 312.6 drink calories.
-
The global beverage market was valued at $1.8 trillion in 2022, indicating robust international demand.
For more detailed insights, explore the data segmented by:
Trends | Segments | Consumers
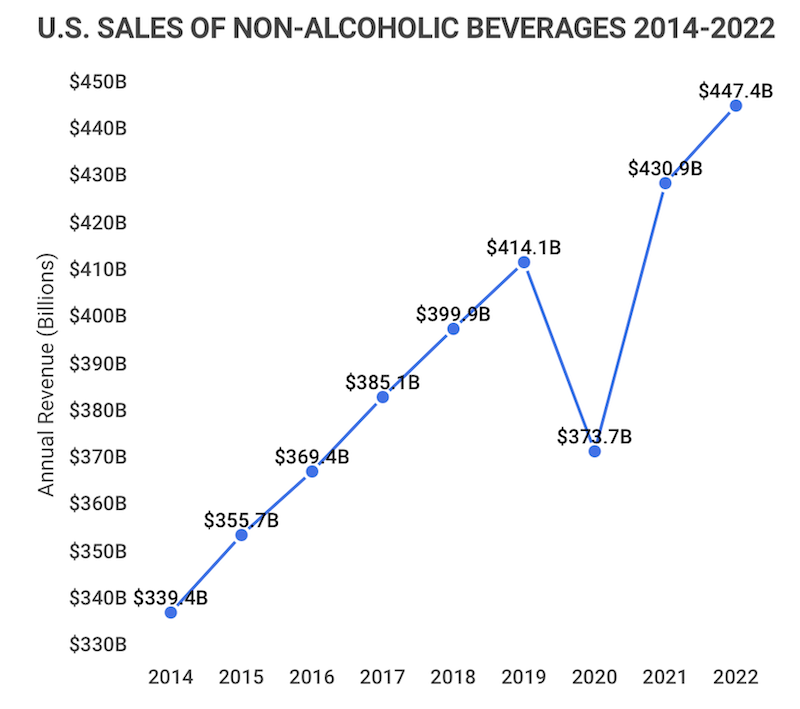
U.S. Sales of Non-Alcoholic Beverages 2014-2022
| Year | U.S. Sales |
|---|---|
| 2022 | $447.4B |
| 2021 | $430.9B |
| 2020 | $373.7B |
| 2019 | $414.1B |
| 2018 | $399.9B |
| 2017 | $385.1B |
| 2016 | $369.4B |
| 2015 | $355.7B |
| 2014 | $339.4B |
General U.S. Beverage Industry Statistics
-
Soft drink sales contributed $297.5 billion to U.S. beverage revenue in 2022.
Carbonated soft drinks continue to dominate, making up a significant portion of the $447 billion beverage industry revenue.
-
Soft drink sales remain one of the fastest-growing categories. Between 2018 and 2019, the industry grew by $200 million, with bottled water also emerging as a strong competitor.
Coca-Cola Zero Sugar was notable for its rapid growth, increasing by 11.5% in retail value and 8% in volume.
-
As of December 2022, the U.S. beverage industry boasts a total market cap of $762.3 billion.
The non-alcoholic beverage sector alone generates approximately $447.38 billion in annual revenue.
-
PepsiCo is the leading beverage company in the U.S.
PepsiCo, founded in 1965, is the largest food and beverage company in North America, with revenues around $66.415 billion annually.
Globally, Anheuser-Busch InBev holds the title of the world’s largest beverage company.
U.S. Beverage Industry Trends and Predictions
-
The U.S. alcoholic beverage industry has expanded significantly.
Since 2006, the alcoholic beverage sector has grown by over $76 billion, highlighting a robust market.
-
The beverage industry is experiencing a compound annual growth rate of 1.7%.
This growth trend suggests the market could exceed $1.691 trillion by the end of 2026.
U.S. Beverage Industry Segment Statistics
-
Beer remains the largest segment in the alcoholic beverage market.
With a volume value of $109.03 billion, beer is the most consumed alcoholic beverage in the U.S.
On average, American adults consume about 94.38 liters of alcoholic drinks annually, costing approximately $748.20.
-
Water is the leading non-alcoholic beverage.
Water accounted for 51.2% of total non-alcoholic beverage consumption from 2015 to 2018, followed by coffee at 14.9%.
Other categories include 10.2% sweetened beverages, 8.7% tea, 5.6% fruit beverages, 5.5% milk, and 3.8% diet beverages.
U.S. Beverage Consumer Statistics
-
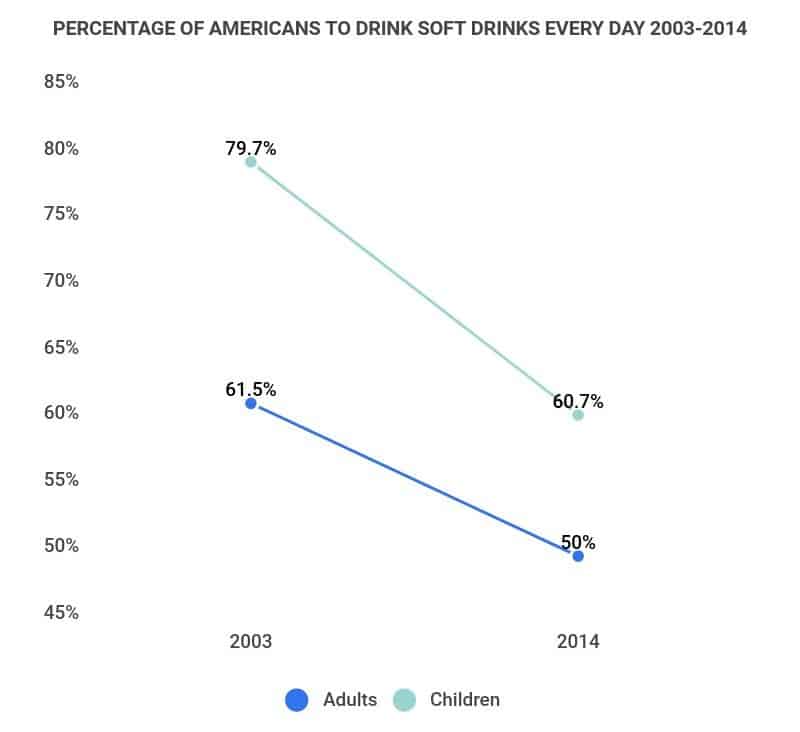
Half of Americans consume soft drinks daily.
50% of American adults and 60.7% of children reported daily consumption of soda or sugary beverages, down from higher figures in previous years.
-
Non-Hispanic Black Americans have the highest consumption of sweetened beverages.
Sweetened beverages account for 14.5% of consumption among this demographic, compared to 14.3% for Hispanics and significantly lower for non-Hispanic White and Asian Americans.
-
Older Americans prefer coffee; younger adults favor water.
Coffee consumption comprises 20.5% among those aged 60 and older, while 56.5% of beverage consumption in the 20-39 age group is water.
U.S. Beverage Industry FAQ
-
How big is the beverage industry in the U.S.?
The U.S. beverage industry is valued at about $760 billion, encompassing both alcoholic and non-alcoholic sectors. On average, alcoholic beverage sales generate around $252.82 billion annually, while non-alcoholic beverages contribute approximately $447.38 billion per year.
-
What is the top-selling beverage in the U.S.?
Water and beer lead as the most popular non-alcoholic and alcoholic beverages in the U.S. The beer industry is valued at $109.03 billion, while water made up 51.2% of non-alcoholic beverage consumption from 2015 to 2018.
-
Is the beverage industry growing?
Yes, the beverage industry is on an upward trajectory. The global beverage market is projected to exceed $1.691 trillion by 2026, reflecting a compound annual growth rate of 1.7% over the next five years.
-
What is the world’s largest soft drink company?
PepsiCo is the largest soft drink company globally, followed by Coca-Cola and Unilever. Notably, Coca-Cola Zero Sugar is among the fastest-growing soft drinks.
-
How competitive is the beverage industry?
The beverage industry is highly competitive. New entrants must contend with established brands like Coca-Cola and Anheuser-Busch, which dominate both the alcoholic and non-alcoholic markets.
-
What is the fastest growing segment of the beverage industry?
Bottled water is the fastest-growing segment, projected to expand at a compound annual rate of 7.4% from 2021 to 2026, significantly outpacing the overall industry growth.
-
What is America’s favorite beverage?
Bottled water tops the list, accounting for 24% of beverage consumption in the U.S., with coffee following closely behind.
-
How many jobs are available in beverages?
There are approximately 955,100 job openings in the U.S. food and beverage industry annually. For instance, in 2021, around 11.38 million jobs were available in the sector.
Conclusion
The U.S. beverage market, covering everything from soft drinks to alcoholic beverages, remains a highly profitable industry. The impressive valuation of approximately $760 billion for the non-alcoholic beverage sector underscores its significance.
Globally, the U.S. continues to lead in beverage production and consumption, generating around $252.82 billion in alcoholic sales and nearly $447.38 billion in non-alcoholic drink sales annually.
With a steady growth forecast of 1.7% CAGR through 2026, the future of the U.S. beverage industry is promising, reflecting evolving consumer preferences and market dynamics.
References
-
Market Watch. “Beverage Market Size Worth 1,691,470 Million USD.” Accessed on September 15, 2021.
-
The Coca-Cola Company. “Report: U.S. Sales Of Non-Alcoholic Beverages Grow More Than $5 Billion In 2019.” Accessed on September 15, 2021.
-
Beverage Companies. “Top 100 Beverage Companies.” Accessed on September 15, 2021.
-
The New York Times. “Americans Are Putting Down The Soda Pop.” Accessed on September 15, 2021.
-
Statista. “Alcoholic Drinks.” Accessed on September 15, 2021.
-
Centers for Disease Control and Prevention. “Non-alcoholic Beverage Consumption Among Adults: United States, 2015-2018.” Accessed on September 15, 2021.
-
Statista. “Non-Alcoholic Drinks – United States.” Accessed on March 2, 2023.
-
Simply Wall St. “U.S. Beverage Industry Analysis.” Accessed on March 6, 2023.
- Industry Statistics
- Wedding Industry Statistics
- Yoga Industry Statistics
- Music Industry Statistics
- Landscaping Industry Statistics
- Bicycle Industry Statistics
- Coffee Industry Statistics
- Car Rental Industry Statistics
- Home Improvement Industry Statistics
- Insurance Industry Statistics
- Supplements Industry Statistics
- Golf Industry Statistics
- Fitness Industry Statistics
- US Media And Entertainment Industry Statistics
- Firearm Industry Statistics
- Financial Services Industry Statistics
- Health And Wellness Industry Statistics
- Trucking Industry Statistics
- Wine Industry Statistics
- Pet Industry Statistics
- Mobile App Industry Statistics
- Digital Marketing Industry Statistics
- Hotel Industry Statistics
- Retail Statistics
- Robotics Industry Statistics
- Jewelry Industry Statistics
- Appointment Scheduling statistics
- Restaurant Industry Statistics
- Food Delivery Statistics
- Food Truck Industry
- Fashion Industry
- Real Estate Industry
- US Film Industry
- US Beverage Industry
- USu202fFast Food Restaurants
- US Construction Industry
- US Book Industry
- Cosmetics Industry
- US Food Retail Industry
- US Pharmaceutical Industry
- US Healthcare Industry
- Airline Industry
- Automobile Industry
- Transportation Industry Statistics
- Event Industry Statistics
- Project Management Statistics
- Oil And Gas Industry Statistics
- Nursing Home Statistics
- Nursing Shortage Statistics
- Nursing Statistics
Author
Chris Kolmar is a co-founder of Zippia and the editor-in-chief of the Zippia career advice blog. He has hired over 50 people in his career, been hired five times, and wants to help you land your next job. His research has been featured on the New York Times, Thrillist, VOX, The Atlantic, and a host of local news. More recently, he's been quoted on USA Today, BusinessInsider, and CNBC.