- HR Statistics
- Average Labor Cost Percent Of Sales
- Average Time to Reach Profitability At A Startup
- Office Space Per Employee
- Recruitment Statistics
- Employee Engagement Statistics
- Work-Life Balance Statistics
- BYOD Statistics
- Paternity Leave Statistics
- Onboarding Statistics
- Average Paid Maternity Leave In Us
- Average Cost Of A Bad Hire
- Employee Theft Statistics
- Paid Family Leave Statistics
- Cost Of Hiring Statistics
- Employee Turnover Statistics
- Average Cost Of Employer Sponsored Health Insurance Statistics
- Sexual Harassment In The Workplace Statistics
- HR Statistics
- PTO Statistics
- Social Media Recruitment Statistics
- Hiring Statistics
- Out Of Prison Employment Statistics
23 Trending Average Labor Cost Statistics [2026]: Labor Cost Percentage By Industry And More
Research Summary. Labor costs are a critical component across all industries, significantly influencing business profitability and operational efficiency. Understanding the nuances of labor costs is essential for strategic planning and budgeting in today’s evolving work environment. Our comprehensive research indicates:
-
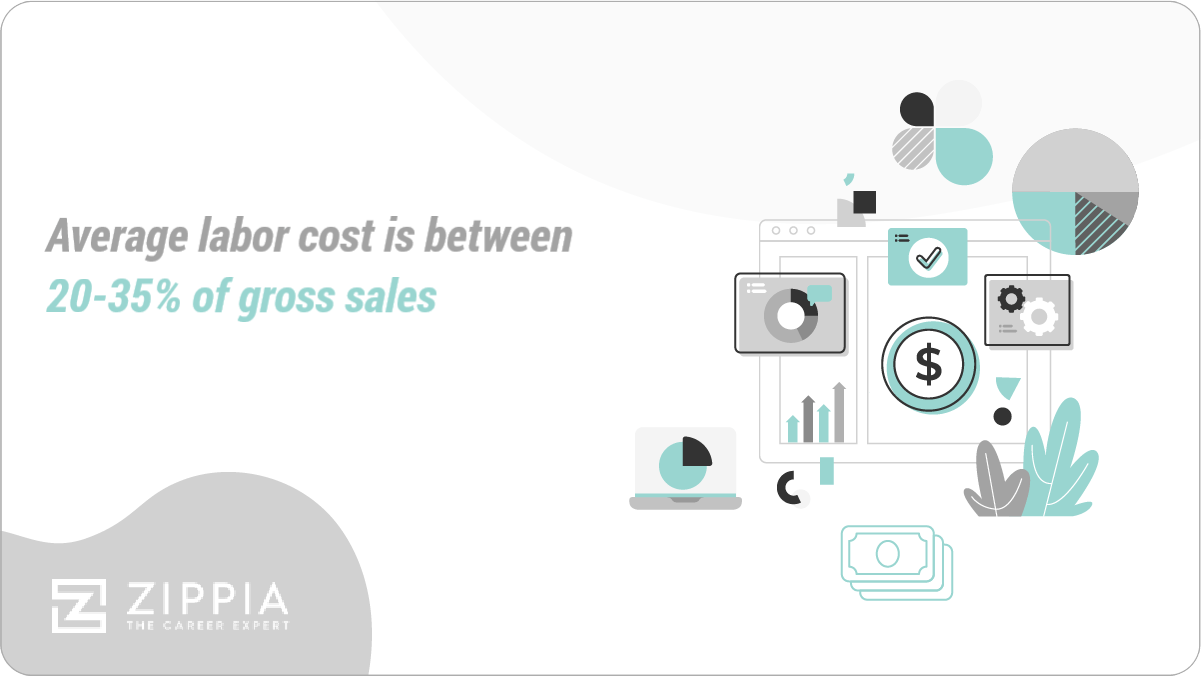
The average labor cost typically ranges from 20-35% of gross sales, varying by industry.
-
Public schools in the U.S. incur the highest labor costs, amounting to $545.8 billion annually.
-
The air transportation sector has seen a notable increase in labor costs, jumping by 106.9% in 2020.
-
As of 2022, private industry workers cost employers an average of $27.44 per hour for wages and salaries, alongside $11.47 for benefits.
For further insights, we provide a detailed breakdown of labor costs by:
Sector | Industry | Breakdown | Trends
General Labor Cost Statistics
Labor costs have a pronounced impact, particularly in sectors facing productivity challenges. The aftermath of the pandemic has reshaped productivity metrics, influencing labor costs significantly. Our research reveals:
-
In the past few years, the top three industries with the highest labor cost increases saw productivity declines exceeding 38%.
In 2020, the industries most affected in terms of unit labor costs included air transportation (106.9%), amusement parks and arcades (76.4%), and travel arrangement and reservation services (73.7%), all severely impacted by restrictions and operational adjustments.
-
Unit labor costs increased in at least 21 industries in 2020.
Many of these industries experienced a tandem fall in productivity, correlating directly with increased labor costs.
-
Public schools, hospitals, and colleges are the highest payers in labor costs.
Public schools lead with expenditures of $545.8 billion, while hospitals and colleges follow with $347.4 billion and $218.9 billion, respectively.
Change in Labor Costs by Industry
| Industry | Unit Labor Costs (2020) |
|---|---|
| Air Transportation | 106.9 |
| Amusement Parks & Arcades | 76.4 |
| Travel Arrangement & Reservation Services | 73.7 |
| Warehousing & Storage | 15 |
| Engineering Services | 11.8 |
| Periodical Publishers | 11.1 |
| Newspaper Publishers | 8.2 |
| Couriers & Messengers | 7.3 |
| Automotive Repair & Maintenance | 6.5 |
| Commercial Banking | 5.1 |
Average Labor Cost By Sector
Labor costs affect various economic sectors differently. For instance, the nondurable manufacturing sector contrasts sharply with the nonfinancial corporate sector regarding labor costs. Here are key findings:
-
As of 2021, the nonfinancial corporate sector reported the most significant decrease in labor costs, totaling 5%.
This sector’s labor costs were notably lower, reflecting a 10% increase in productivity compared to the previous year.
-
The business sector experienced the highest percentage increase in labor costs, at 1.4%.
This modest rise is accompanied by stagnant productivity growth, increasing from 2% to 2.4% in the same period.
-
From 2020 to 2021, the durable manufacturing sector recorded a dramatic decline in labor costs, decreasing by 155.71%.
Labor costs in this sector shifted from an increase in 2020 to a decrease by mid-2021.
Average Labor Cost By Industry
Labor costs vary significantly across industries in the U.S. Key considerations include whether an industry is public or private. Here are some noteworthy points:
-
Compensation costs for private industry workers increased by 33% more than those of government workers.
Between June 2020 and June 2021, private industry worker compensation costs rose by 3.1%, while government employees saw a modest increase of 2%.
-
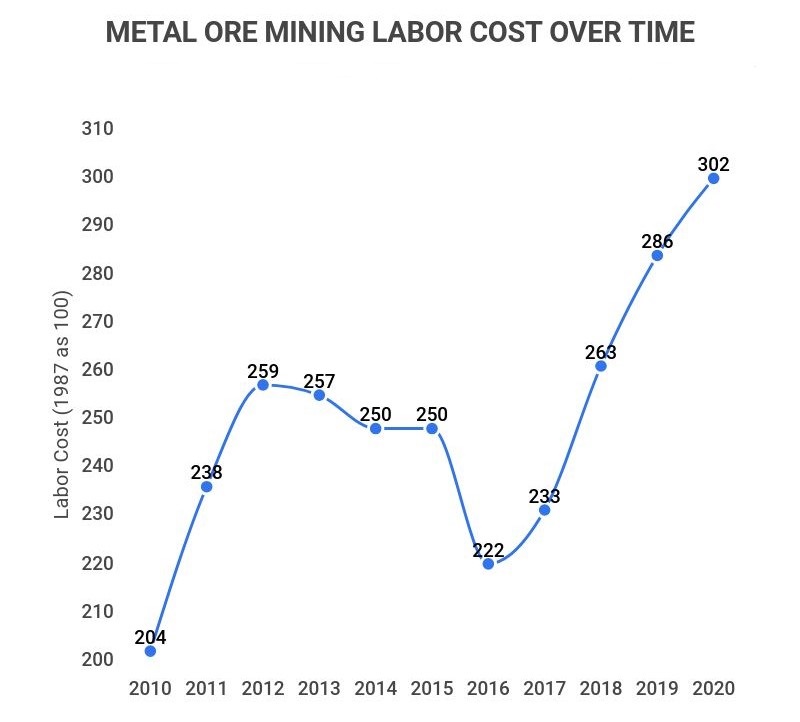
Metal ore mining recorded one of the steepest percentage increases in labor costs since 1987, reaching an increase of 202%.
This surge is juxtaposed with stagnant productivity, where growth has only risen by 4.9% over three decades.
-
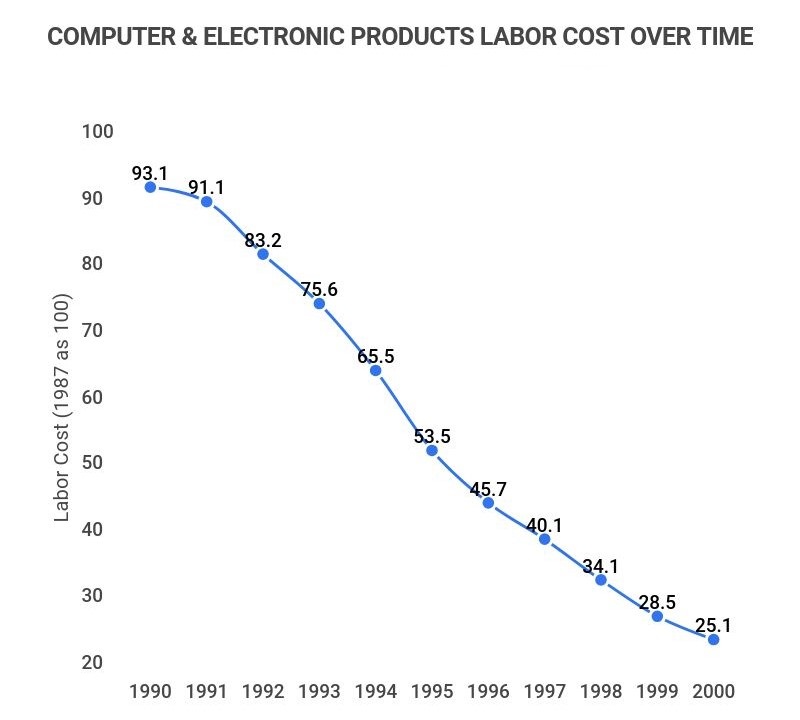
The labor cost for computer and electronic products has decreased by 78.4% since 1987.
This is the most significant decline among industries and aligns with a remarkable productivity increase of over 1,000% in the same timeframe.
Breakdown of Average Labor Costs
Labor costs encompass wages, salaries, and benefits, with their impact varying significantly by industry. Here’s what our research unveiled:
-
Wage and salary costs for civilian and private industries increased by over 3%.
As of June 2021, labor costs for civilian and private industries rose to 3.2% and 3.5%, respectively, outpacing increases in compensation or benefits.
-
Benefits have seen the most considerable labor cost increase for state and local government industries at 2.6%.
This increase is notable, given that it surpasses the wage and salary increase of 1.6% for government workers.
-
As of June 2021, the percentage increase in compensation costs was lower in government industries, at 2%.
In contrast, civilian and private industries saw increases of 2.9% and 3.1%, respectively.
-
In the past 12 months, the largest increase in labor costs was in wages and salaries for private industries, which rose by 17%.
This figure demonstrates a significant jump from a previous increase of 2.9% to 3.5% as of June 2021.
-
The largest decrease in labor cost over the past year was in wages and salaries for government industries, which fell by 39%.
This decline shifted from an increase of 2.6% in June 2020 to 1.6% in June 2021.
Cost of Wages and Salaries Increase 2020-2021
| Industry Type | % Increase From June 2020-2021 | % Increase December 2020-2021 |
|---|---|---|
| Civilian Workers | 3.2 | 4.5 |
| Private Industry Workers | 3.5 | 5 |
| State & Local Government Workers | 1.6 | 2.7 |
Cost of Benefits Increase 2020-2021
| Industry Type | % Increase From June 2020-2021 | % Increase December 2020-2021 |
|---|---|---|
| Civilian Workers | 2 | 2 |
| Private Industry Workers | 2 | 2 |
| State & Local Government Workers | 2 | 2 |
Cost of Compensation Increase 2020-2021
| Industry Type | % Increase From June 2020-2021 | % Increase December 2020-2021 |
|---|---|---|
| Civilian Workers | 2.9 | 4 |
| Private Industry Workers | 3.1 | 4.4 |
| State & Local Government Workers | 2 | 2.6 |
Average Labor Cost Trends
Labor cost trends have evolved, particularly influenced by the pandemic’s aftermath. While overall labor costs have generally risen, our findings include:
-
Average labor costs increased by 75% from 1987 to 2019.
This average encompasses 26 industries and three sectors, with notable outliers such as ore mining and tobacco, where labor costs soared over 100%. The computer and electronic products sector remains unique, showing a decrease of 78.4% in labor costs.
-
The overall mining sector has experienced one of the largest labor cost increases, at 97.2%.
Additionally, the nondurable manufacturing sector follows closely with an average increase of 94.1% since 1987.
-
Government employee benefits have surged by 66.2% since 2005.
In contrast, civilian and private industry workers saw increases of 46.3% and 40.6%, respectively.
-
Since 2005, private industry has experienced the highest rise in wages and salaries, averaging 45.8%.
This marginally surpasses the increases seen in civilian and government industries, at 44.1% and 36.6%, respectively.
-
Aircraft manufacturers have seen the least increase in labor costs since December 2005, at only 24.7%.
This is particularly intriguing, given the air transportation industry’s significant rise in labor costs of 106.9% in 2020.
Average Labor Cost FAQ
-
What is the average cost of labor?
The average cost of labor is 20-35% of gross sales. However, this varies significantly across different sectors and industries. For instance, the metal ore mining industry has experienced a 202% increase in labor costs since 1987, while the computer and electronic products sector has seen a decrease of 78.4% over the same period.
-
What is the BLS Employment Cost Index?
The BLS Employment Cost Index (ECI) provides a consistent quarterly measure of changes in total labor costs. These changes encompass compensation, wages and salaries, and benefits across various industries.
-
ECI is calculated based on labor cost data collected from a sample of jobs within selected industries or sectors. This data is compiled to yield averages and percentages.
-
How much have labor costs increased in the past year?
U.S. labor costs have seen a 4% increase over the past year. This marks the largest year-over-year increase since 2001. Rising wages at 4.5% and inflation over 2% contribute to this trend. The average labor cost has increased by a substantial 75% since 1987.
-
How do you calculate average labor cost?
Average labor cost is calculated by factoring in all employment-related expenses. The formula is:
LPH (Labor Cost per Hour) = (gross pay + all annual costs) ÷ actual hours worked per year
To determine gross pay:
-
Gross pay = gross hourly rate x number of hours worked per pay period
-
40 hours per week x 52 weeks in a year = 2080 hours
-
2080 hours x $15 per hour = $31,200 gross pay
Next, consider the actual hours worked, accounting for any sick or personal days. For instance, if a worker took 20 days off:
-
Hours not worked = 20 days x 8 hours = 160 hours
-
2080 hours − 160 hours = 1,920 actual hours worked
Finally, include extra annual costs, such as taxes, benefits, and overtime:
-
$2,500 annual taxes
-
$3,500 health insurance
-
$1,000 benefits
-
$600 overtime
-
Total: $7,600
Using the initial formula, the labor cost per hour is:
-
LPH (Labor Cost per Hour) = (gross pay + all annual costs) ÷ actual hours worked per year
-
($31,200 + $7,600) ÷ 1,920 = $20.21 labor cost per hour
-
-
What percentage of cost should be labor?
Labor costs should constitute 20-35% of total costs. This varies widely by industry. For example, air transportation had an extraordinary labor cost of 106.9%, followed by amusement parks & arcades (76.4%) and travel arrangement & reservation services (73.7%). Such high figures explain the widespread layoffs and closures during the pandemic.
-
Is labor the biggest cost?
Yes, labor typically represents the largest expense for companies. Labor costs account for approximately 60% of total company expenses, a trend that continues to rise. The pandemic has heightened worker demands for fair compensation and better benefits, leading to increased labor costs for competitive advantage.
Conclusion
Labor costs have been on a consistent upward trajectory for decades across most industries, with the notable exception of the computer and electronic products sector. The pandemic has intensified these trends, as evidenced by the air transportation industry’s staggering 106.9% increase in labor costs in 2020.
Labor cost increases are not confined to one area but span compensation, wages, and benefits, with benefits particularly rising for government jobs (up 66.2%) and wages for private industry jobs (up 45.8%).
Looking ahead, labor costs are expected to continue their upward trend, although industries hit hard by the pandemic may see a return to more normalized labor cost levels.
References
-
BLS. “Productivity and Costs by Industry Selected Service-Providing Industries – 2020.” Accessed on September 27th, 2021.
-
IBISWorld. “Industries with the Highest Labor Costs in the US in 2021.” Accessed on September 27th, 2021.
-
BLS. “Productivity and Costs, Second Quarter 2021, Revised.” Accessed on September 27th, 2021.
-
BLS. “Employment Cost Index – June 2021.” Accessed on September 27th, 2021.
-
BLS. “Labor cost indexes by industry.” Accessed on September 27th, 2021.
-
BLS. “Employment Cost Index Summary.” Accessed on September 27th, 2021.
- HR Statistics
- Average Labor Cost Percent Of Sales
- Average Time to Reach Profitability At A Startup
- Office Space Per Employee
- Recruitment Statistics
- Employee Engagement Statistics
- Work-Life Balance Statistics
- BYOD Statistics
- Paternity Leave Statistics
- Onboarding Statistics
- Average Paid Maternity Leave In Us
- Average Cost Of A Bad Hire
- Employee Theft Statistics
- Paid Family Leave Statistics
- Cost Of Hiring Statistics
- Employee Turnover Statistics
- Average Cost Of Employer Sponsored Health Insurance Statistics
- Sexual Harassment In The Workplace Statistics
- HR Statistics
- PTO Statistics
- Social Media Recruitment Statistics
- Hiring Statistics
- Out Of Prison Employment Statistics
Author
Chris Kolmar is a co-founder of Zippia and the editor-in-chief of the Zippia career advice blog. He has hired over 50 people in his career, been hired five times, and wants to help you land your next job. His research has been featured on the New York Times, Thrillist, VOX, The Atlantic, and a host of local news. More recently, he's been quoted on USA Today, BusinessInsider, and CNBC.