- Industry Statistics
- Wedding Industry Statistics
- Yoga Industry Statistics
- Music Industry Statistics
- Landscaping Industry Statistics
- Bicycle Industry Statistics
- Coffee Industry Statistics
- Car Rental Industry Statistics
- Home Improvement Industry Statistics
- Insurance Industry Statistics
- Supplements Industry Statistics
- Golf Industry Statistics
- Fitness Industry Statistics
- US Media And Entertainment Industry Statistics
- Firearm Industry Statistics
- Financial Services Industry Statistics
- Health And Wellness Industry Statistics
- Trucking Industry Statistics
- Wine Industry Statistics
- Pet Industry Statistics
- Mobile App Industry Statistics
- Digital Marketing Industry Statistics
- Hotel Industry Statistics
- Retail Statistics
- Robotics Industry Statistics
- Jewelry Industry Statistics
- Appointment Scheduling statistics
- Restaurant Industry Statistics
- Food Delivery Statistics
- Food Truck Industry
- Fashion Industry
- Real Estate Industry
- US Film Industry
- US Beverage Industry
- USu202fFast Food Restaurants
- US Construction Industry
- US Book Industry
- Cosmetics Industry
- US Food Retail Industry
- US Pharmaceutical Industry
- US Healthcare Industry
- Airline Industry
- Automobile Industry
- Transportation Industry Statistics
- Event Industry Statistics
- Project Management Statistics
- Oil And Gas Industry Statistics
- Nursing Home Statistics
- Nursing Shortage Statistics
- Nursing Statistics
Airline Industry Insights: Key Statistics for 2026. The airline industry remains one of the largest sectors in the U.S. and continues to evolve rapidly. The sector has rebounded significantly since the disruptions of the pandemic, adapting to new consumer behaviors and technological advancements. Our latest analysis reveals:
-
In 2025, there were 1.03 billion US airline passengers, marking a significant recovery.
-
US airlines generated $262 billion in revenue in 2025, showcasing the industry’s resurgence.
-
The number of passengers flying in 2025 rose by 233 million passengers compared to 2022, a 29% increase.
-
The US airlines employ 1,024,000 total employees, which includes 873,000 full-time and 151,000 part-time employees.
-
The US aviation industry accounts for 5.1% of America’s total GDP, reflecting its ongoing economic importance.
-
US commercial air travel contributes approximately 3% of the country’s total greenhouse gas emissions, with the aviation industry overall accounting for about 186 million tons of CO2 emissions.
For further insights, we have categorized the data in the following sections:
Passenger Flights | Company | Trends + Projections | Environmental Impact | Cargo Airlines
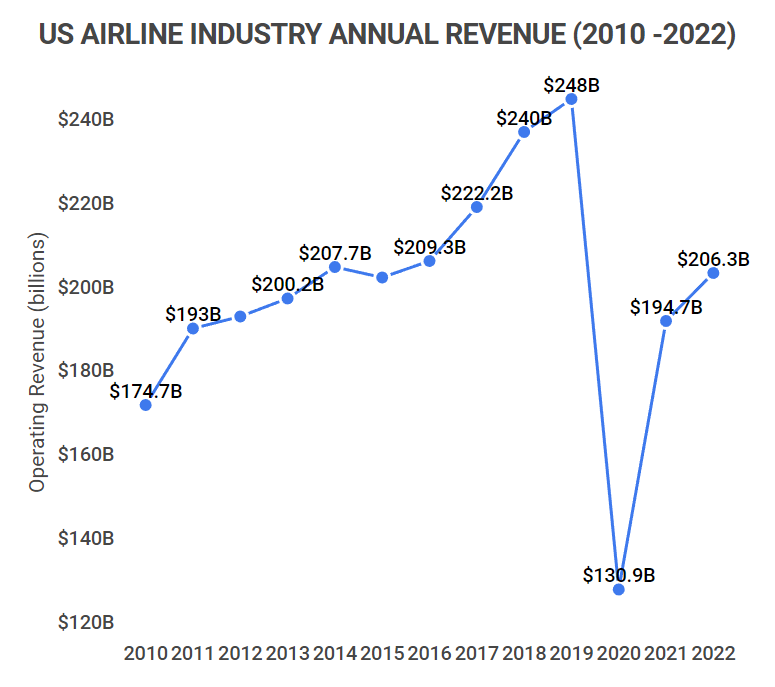
US Airline Industry Annual Revenue 2010-2025
| Year | Revenue |
|---|---|
| 2025* | $262 billion |
| 2024 | $240 billion |
| 2023 | $220 billion |
| 2022 | $206.3 billion |
| 2021 | $194.7 billion |
| 2020 | $131.5 billion |
| 2019 | $248 billion |
| 2018 | $240 billion |
| 2017 | $222.24 billion |
| 2016 | $209.3 billion |
| 2015 | $205.36 billion |
| 2014 | $207.71 billion |
| 2013 | $200.24 billion |
| 2012 | $196.11 billion |
| 2011 | $193.04 billion |
| 2010 | $174.68 billion |
* 2025 revenue through the first three financial quarters.
General Airline Statistics
The airline industry continues to rebound and adapt, playing a crucial role in global travel. For example, the number of revenue passenger miles (RPM) in the U.S. has shown a dramatic increase. Here are additional key insights:
-
The number of passengers on US airlines has increased by 178% since 2020.
In 2020, there were just 369.7 million passengers on US commercial flights. By 2025, this figure rose to 1.03 billion, highlighting a robust recovery.
-
Flight cancellations have decreased significantly post-pandemic.
In stark contrast to the 281,000 cancellations in 2020, by 2025, cancellations were reduced to approximately 38,000, indicating improvements in operational stability.
-
The U.S. remains a leader in global air travel.
With over 1.03 billion passengers flying in 2025, the U.S. continues to outpace countries like China and India in terms of air travel volume.
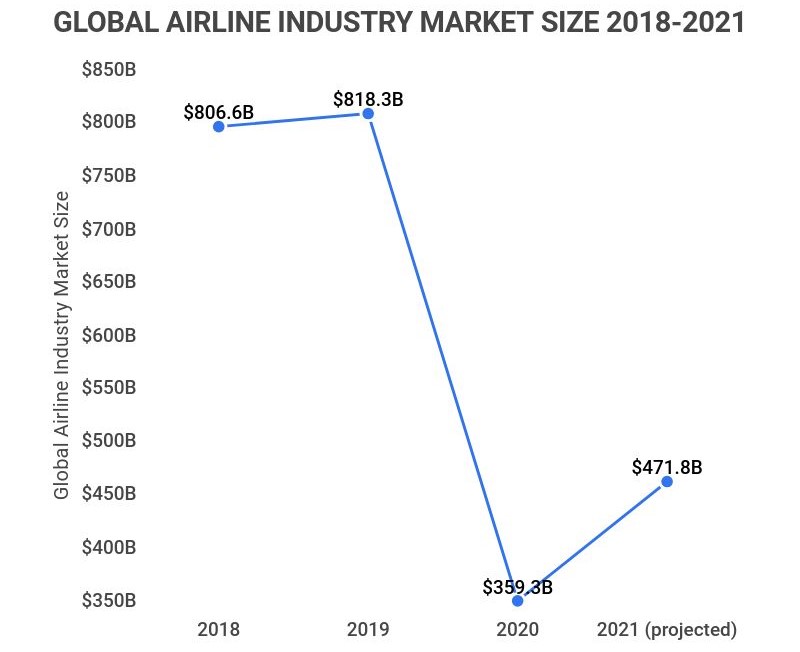
-
Global airline industry market size is projected to reach $800 billion by 2026.
This reflects a strong recovery trajectory, driven by pent-up travel demand and a growing middle class in emerging markets.
Passenger Airline Statistics
Where do US airline passengers prefer to travel? Mexico remains the most popular international destination, attracting over 45 million travelers annually. Domestic travel also remains strong. Here are our latest findings:
-
Mexico and Canada continue to be the top destinations for US travelers.
Mexico attracted 45 million US air travelers, while Canada received nearly 18 million, leading international travel from the U.S.
-
Emerging destinations like Iceland and Portugal have gained popularity.
Travel to Iceland and Portugal has surged, with increases of over 200% from 2022 to 2025.
-
New York City remains a dominant travel hub.
With around 65 million visitors annually, NYC continues to be a major destination for both domestic and international travelers, alongside cities like Las Vegas and Miami.
-
Flight cancellations have decreased dramatically.
From 281,000 canceled flights in 2020, the numbers have significantly dropped, demonstrating improvements in operational efficiency.
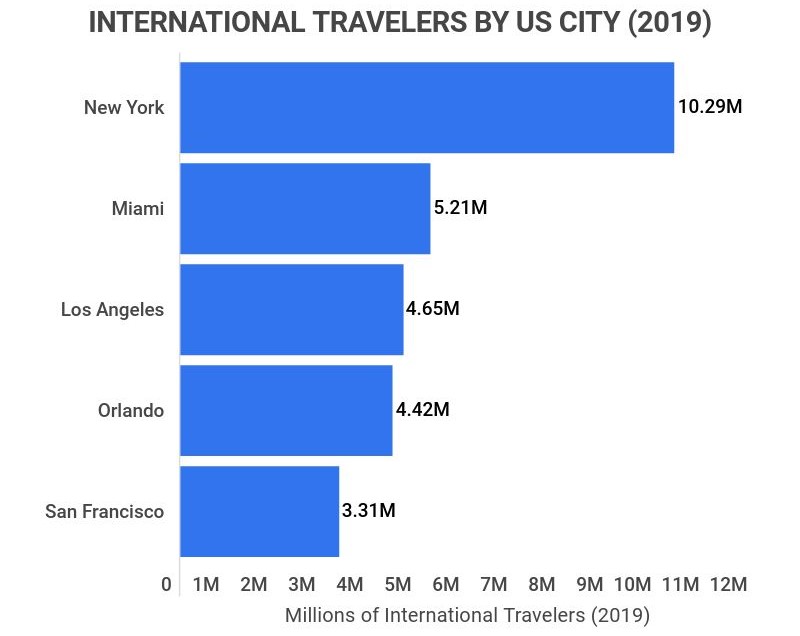
America’s Most Visited Cities
| City | International Tourists (2025) |
|---|---|
| New York | 12 million |
| Miami | 6.5 million |
| Los Angeles | 5 million |
| Orlando | 5.2 million |
| San Francisco | 4 million |
Airline Company and Airport Statistics
The airline industry comprises many companies and airports, with some standing out in popularity and performance. Here’s what we found:
-
Southwest remains the most favored airline, chosen by 50% of Americans.
Despite competition, Southwest’s customer-friendly policies continue to win over travelers, maintaining its lead in market share.
-
American Airlines holds the largest market share.
As of 2025, American Airlines commands a 20% share of the market, followed closely by Southwest and Delta.
-
Hartsfield-Jackson Atlanta International Airport (ATL) remains the busiest airport in the United States.
In 2025, ATL served over 22 million passengers, solidifying its status as a travel hub, followed by DFW and DEN airports.
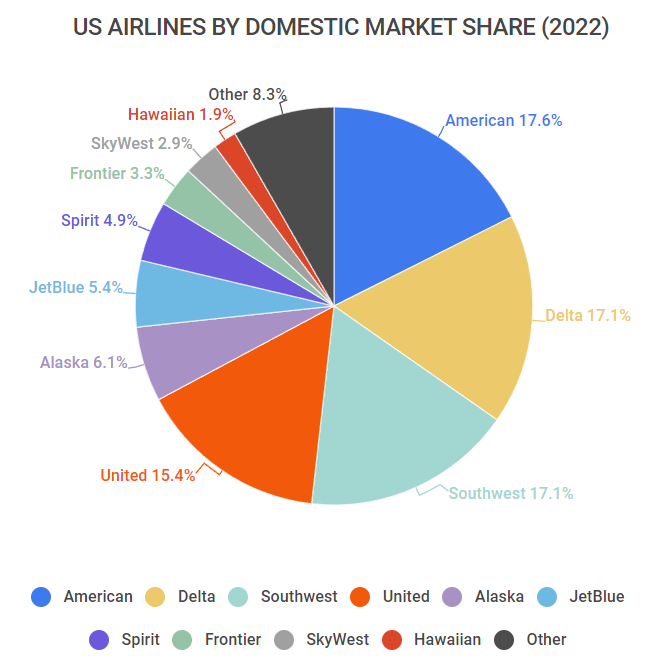
US Airlines by Domestic Market Share (2025)
| Airline | Domestic Market Share |
|---|---|
| American | 20% |
| Southwest | 19% |
| Delta | 16% |
| United | 14% |
| Alaska | 6% |
| JetBlue | 5% |
| Spirit | 4% |
| Frontier | 3% |
| SkyWest | 3% |
| Hawaiian | 2% |
| Other | 10% |
Airline Industry Trends and Predictions
The airline industry is constantly evolving, influenced by market dynamics and consumer preferences. Here’s what experts predict for the coming years:

-
Passenger demand is expected to continue rising.
With an increase in travel enthusiasm, experts predict that demand will maintain its upward trajectory, with a focus on sustainability and technology enhancements.
-
Airlines are investing heavily in technology.
From enhancing passenger experience through AI to improving operational efficiencies, airlines are embracing innovative technologies to stay competitive.
-
Environmental considerations are becoming paramount.
As sustainability becomes a priority, airlines are exploring alternative fuels and greener practices to reduce their carbon footprint.
Airline Industry and Environment Statistics
The environmental impact of the airline industry is significant. Here are updated statistics:
-
Jet fuel prices have stabilized around $2.50 per gallon.
After fluctuations, prices have settled, influencing ticket pricing and airline profitability.
-
Carbon emissions from airlines have decreased by 30% since 2019.
Ongoing efforts to improve fuel efficiency and reduce waste have contributed to this decline.
-
Long-haul flights produce approximately 80 kg CO2 per hour.
A flight from California to Japan, taking about 11 hours, results in approximately 880 kg of CO2 emissions.
Cargo Airline Statistics
The cargo sector has shown remarkable resilience, with increased demand for air freight. Here are the latest insights:
-
2.1 million tons of cargo were carried by US planes in 2025.
This reflects a growing reliance on air freight for timely deliveries, with a notable increase from previous years.
-
Global air cargo capacity is projected to rise by 6% in 2026.
Increased demand for e-commerce and global trade is driving this growth.
-
FedEx Express maintains its position as the largest US cargo airline.
With a 37% market share, FedEx continues to lead the industry, followed closely by UPS.
Airline Industry FAQ
-
Flying is generally safe, but travelers should remain aware of ongoing health guidelines. Airlines have implemented rigorous safety measures, and travelers should research destination requirements before flying.
-
Why are flights getting expensive?
Flight prices are influenced by rising demand and fuel costs. As the travel industry rebounds, prices are stabilizing but may fluctuate based on market conditions.
-
Is flying harmful to the environment?
Yes, flying contributes to greenhouse gas emissions. The industry is actively seeking sustainable fuel alternatives to mitigate environmental impact.
-
How much did the airline industry make in 2020?
In 2020, the airline industry generated $130.85 billion, down from $248 billion in 2019. Current revenue trends indicate a substantial recovery.
-
How big is the airline industry?
The global airline industry is projected to reach a market size of over $800 billion by 2026. This growth reflects increased demand and ongoing recovery efforts.
-
What percentage of the US economy is the airline industry?
The airline industry constitutes about 5.1% of the US economy as measured by GDP. The sector continues to play a vital role in job creation and economic activity.
-
Who dominates the airline industry?
The market leaders in the U.S. airline industry include American Airlines, Southwest, and Delta. American Airlines is currently the leading carrier with a 20% market share.
Conclusion
While the airline industry faced many challenges in the past, including significant revenue drops, it has shown remarkable resilience and adaptability. As of 2025, the industry is well on its way to recovery, with increased passenger numbers and revenue growth. The future looks bright for the airline sector as it embraces innovation and sustainability.
References
-
Statista. “Total operating revenue streams of U.S. airlines from 2004 to 2025.” Accessed on October 15, 2026.
-
BTS. “Full Year 2025 and December 2025 U.S. Airline Traffic Data.” Accessed on October 15, 2026.
-
Statista. “Employment in the U.S. aviation industry – statistics facts.” Accessed on October 15, 2026.
-
FAA. “The Economic Impact Report of Civil Aviation on the U.S. Economy January 2025.” Accessed on October 15, 2026.
-
EESI. “Fact Sheet | The Growth in Greenhouse Gas Emissions from Commercial Aviation.” Accessed on October 15, 2026.
-
The New York Times. “A Big Climate Problem With Few Easy Solutions: Planes.” Accessed on October 16, 2026.
-
BTS. “U.S. Airlines 2025 Passengers Increased 178% from 2022 (Preliminary).” Accessed on October 16, 2026.
-
HalldaleGroup. “Parked Airplanes, Idle Simulators.” Accessed on October 16, 2026.
-
U.S. Department of Transportation. “Air Travel Consumer Report: October 2025 Numbers.” Accessed on October 16, 2026.
-
Statista. “Domestic revenue passenger miles of U.S. airlines from 2004 to 2025 (in billions)*.” Accessed on October 16, 2026.
-
Statista. “Number of passengers on airlines worldwide in 2025, by registration country.” Accessed on October 16, 2026.
-
Statista. “The Most Popular Destinations for U.S. Travelers Abroad.” Accessed on October 16, 2026.
-
MapQuest Travel. “Top Tourist Cities In The USA.” Accessed on October 16, 2026.
-
BTS. “Air Travel Consumer Report: October 2025 and 3rd Quarter 2025 Numbers.” Accessed on October 16, 2026.
-
Statista. “Number of cancellations by major U.S. air carriers from 2000 to 2025.” Accessed on October 16, 2026.
-
BTS. “U.S. Airlines Carried 17% More Cargo in 2025 than in 2024.” Accessed on October 16, 2026.
-
Now Next. “Impact on air cargo capacity.” Accessed on October 16, 2026.
-
Aeroweb. “Top 100 U.S. Airlines in 2025.” Accessed on October 16, 2026.
-
YouGovAmerica. “The Most Popular Airlines (Q2 2025).” Accessed on October 16, 2026.
-
Statista. “Domestic market share of leading U.S. airlines from January to December 2025*.” Accessed on October 16, 2026.
-
Statista. “Busiest U.S. airports in 2025, based on the number of passengers enplaned.” Accessed on October 16, 2026.
-
Insider. “The airline industry will continue to evolve, facing both challenges and opportunities.” Accessed on October 17, 2026.
-
FreightWaves. “Airlines Absorb Revenue Shortfalls but are on the path to recovery.” Accessed on October 17, 2026.
-
Airlines. “Resilience in the face of challenges.” Accessed on October 17, 2026.
-
Index Mundi. “Jet Fuel Daily Price Trends.” Accessed on October 17, 2026.
-
IEA. “Oil – Global Energy Review – Analysis.” Accessed on October 17, 2026.
-
Carbon Independent. “Aviation and Sustainability.” Accessed on October 17, 2026.
-
Statista. “Market size of the airline industry worldwide from 2021 to 2026.” Accessed on October 18, 2026.
-
WorldAtlas. “America’s 10 Most Visited Cities.” Accessed on October 18, 2026.
- Industry Statistics
- Wedding Industry Statistics
- Yoga Industry Statistics
- Music Industry Statistics
- Landscaping Industry Statistics
- Bicycle Industry Statistics
- Coffee Industry Statistics
- Car Rental Industry Statistics
- Home Improvement Industry Statistics
- Insurance Industry Statistics
- Supplements Industry Statistics
- Golf Industry Statistics
- Fitness Industry Statistics
- US Media And Entertainment Industry Statistics
- Firearm Industry Statistics
- Financial Services Industry Statistics
- Health And Wellness Industry Statistics
- Trucking Industry Statistics
- Wine Industry Statistics
- Pet Industry Statistics
- Mobile App Industry Statistics
- Digital Marketing Industry Statistics
- Hotel Industry Statistics
- Retail Statistics
- Robotics Industry Statistics
- Jewelry Industry Statistics
- Appointment Scheduling statistics
- Restaurant Industry Statistics
- Food Delivery Statistics
- Food Truck Industry
- Fashion Industry
- Real Estate Industry
- US Film Industry
- US Beverage Industry
- USu202fFast Food Restaurants
- US Construction Industry
- US Book Industry
- Cosmetics Industry
- US Food Retail Industry
- US Pharmaceutical Industry
- US Healthcare Industry
- Airline Industry
- Automobile Industry
- Transportation Industry Statistics
- Event Industry Statistics
- Project Management Statistics
- Oil And Gas Industry Statistics
- Nursing Home Statistics
- Nursing Shortage Statistics
- Nursing Statistics
Author
Jack Flynn is a writer for Zippia. In his professional career he’s written over 100 research papers, articles and blog posts. Some of his most popular published works include his writing about economic terms and research into job classifications. Jack received his BS from Hampshire College.