Research Summary. If you’ve traveled often, you’ve likely experienced American Airlines at some point. As one of the largest airlines in the United States and globally, American Airlines has been operational since 1926, marking nearly a century of transporting passengers and cargo across the globe. Here are some essential statistics about American Airlines as of 2026.
-
In 2022, American Airlines served 165.68 million passengers.
-
American Airlines Group employs approximately 123,400 individuals.
-
The fleet of American Airlines Group consists of 1,432 aircraft.
-
In 2022, American Airlines Group reported an annual revenue of $29.88 billion.
For further insights, we have categorized the data as follows:
Flights and Destinations | Passengers | Company Stats | Trends
American Airlines Statistics by Flights and Destinations
-
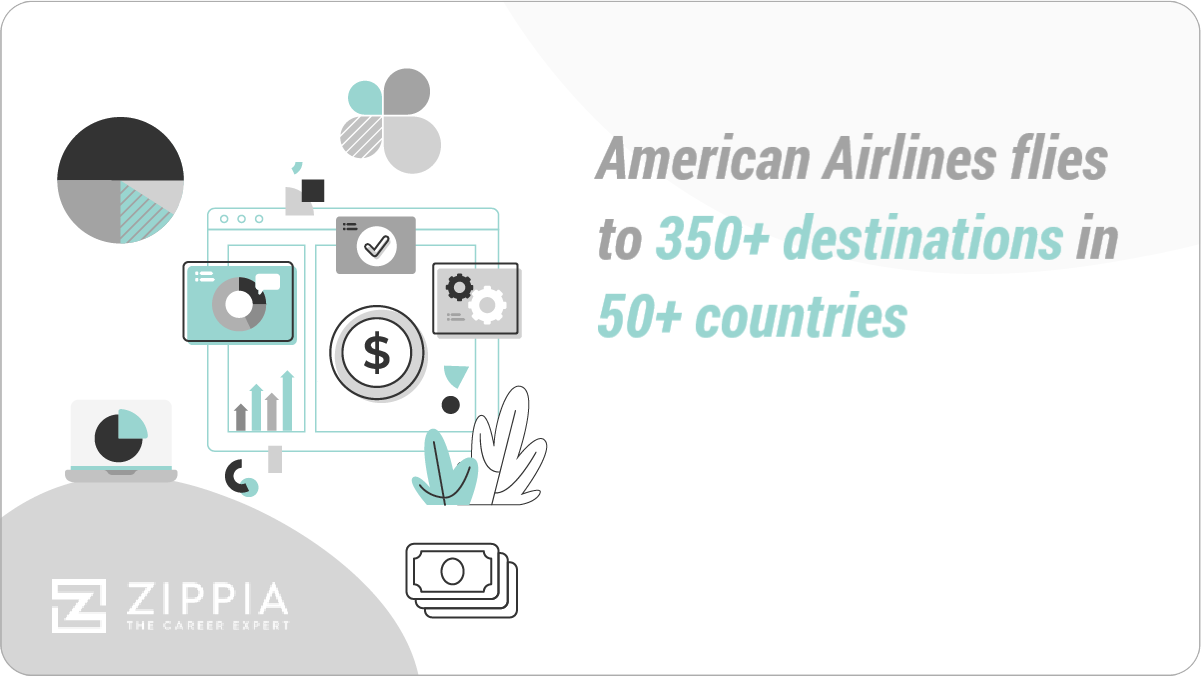
American Airlines Group operates flights to 350 destinations worldwide.
-
The airline provides routes to over 50 countries.
-
Together with its regional partner American Eagle, American Airlines averages around 6,700 flights daily.
-
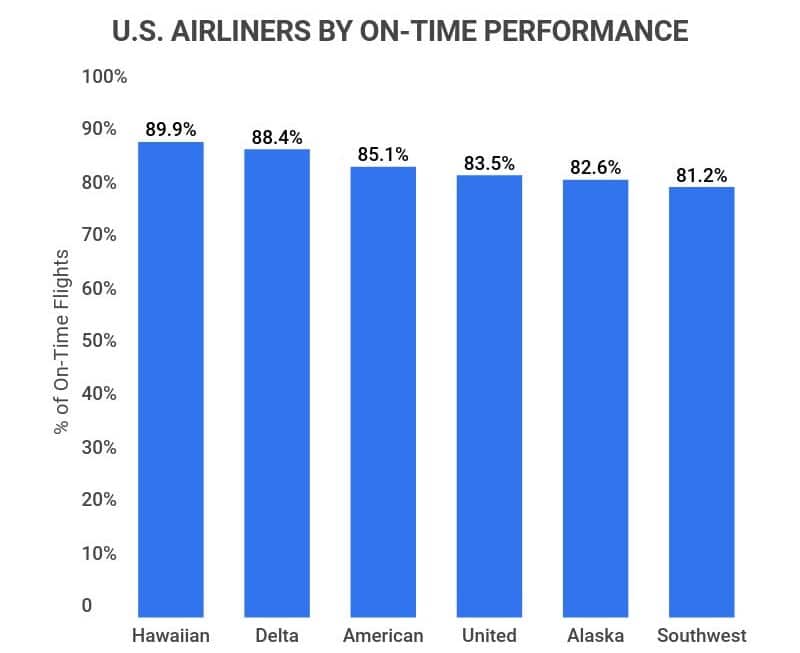
In 2022, 85.1% of American Airlines flights arrived on time, positioning it as the third most punctual airline in the U.S.
American Airlines Statistics by Passengers
-
In 2022, American Airlines recorded an average occupancy rate of 75.3% for its domestic flights.
This indicates that approximately 75% of American Airlines’s seats were filled by paying customers on any given U.S. flight in 2022.
-
The AAdvantage loyalty program boasts around 115 million members.
Launched in 1981, AAdvantage was initially an exclusive membership program, but today anyone can join for free, with 144,000 original members still active.
-
In 2022, American Airlines achieved 2.082 billion cargo ton-miles.
This metric illustrates the airline’s cargo transport capacity, reflecting a significant increase from 1.383 billion ton-miles in 2021.
American Airlines Company Statistics
-
American Airlines commands a 19.5% share of the U.S. domestic airline market.
It leads the market, followed by Southwest Airlines at 17.4%. Here’s a snapshot of the top U.S. domestic airlines by market share as of 2022:
Airline U.S. Domestic Airline Market Share American Airlines 19.5% Southwest Airlines 17.4% Delta Airlines 16.3% United Airlines 12.9% Alaska Airlines 5.4% JetBlue Airways 5.3% Spirit Airlines 4.9% SkyWest Airlines 3.4% Frontier Airlines 3.3% Hawaiian Airlines 1.7% Other 9.9% 
-
As of April 2022, American Airlines was valued at $44.94 billion.
This valuation marked a decline from its December 2021 peak of $57.1 billion, attributed to ongoing economic recovery challenges.
-
In 2022, American Airlines Group ranked 174 on the Fortune 500 list.
This drop from its previous rank of 70 in 2020 reflects the financial challenges faced during the pandemic, where it reported significant losses.
American Airlines Trends
-
Annual revenue for American Airlines Group rose from $24.86 billion in 2012 to $29.88 billion in 2022.
The revenue peaked at $45.77 billion in 2019 before the pandemic-induced drop to $17.34 billion in 2020.
Below is a summary of American Airlines Group’s annual revenue from 2012 to 2022:
Year Annual Revenue 2012 $24.86 billion 2013 $26.74 billion 2014 $42.65 billion 2015 $40.99 billion 2016 $40.14 billion 2017 $42.62 billion 2018 $44.54 billion 2019 $45.77 billion 2020 $17.34 billion 2021 $29.88 billion 2022 $30.45 billion -
The number of American Airlines passengers decreased significantly during the pandemic.
From 215.18 million passengers in 2019, the count fell to just 95.32 million in 2020. Although there was a rebound in 2021, the numbers have yet to return to pre-pandemic levels.
-
American Airlines Group reported a net loss of nearly $2 billion in 2021.
This marked a continued trend of declining profits after a prior record of six consecutive profitable years.
American Airlines Statistics FAQ
-
How many people fly with American Airlines each year?
Typically, around 200 million individuals fly with American Airlines annually. This was true before the pandemic, which drastically reduced passenger numbers in 2020. The airline has made strides in recovery, serving 165.68 million passengers in 2022.
-
Is American Airlines the most popular airline in the United States?
Yes, American Airlines is the leading airline in the U.S. While it may not always rank highest in passenger satisfaction or timeliness, it holds the largest market share, indicating its popularity.
-
How many people work for American Airlines?
American Airlines Group employs over 123,000 individuals. This workforce includes both American Airlines and its regional partner American Eagle.
-
What is the current value of American Airlines?
As of 2022, American Airlines is valued at $44.94 billion. This valuation reflects the ongoing recovery from the pandemic’s impact on the airline industry.
-
How many aircraft does American Airlines operate?
American Airlines has a fleet of 1,432 aircraft. This includes both mainline and regional aircraft, with a continued focus on expanding its fleet as operations normalize.
-
What is American Airlines’s annual revenue?
The annual revenue for American Airlines is $29.88 billion. While this marks a recovery from the lows of 2020, it remains below its pre-pandemic revenue levels.
Conclusion
American Airlines remains a key player in the travel industry, holding a 19.5% market share of the U.S. domestic airline sector. With 165.68 million passengers traveling to over 350 destinations in 50 countries, the airline is a significant entity in global aviation. Despite the challenges posed by the pandemic, American Airlines is on a recovery path, with revenue reaching $29.88 billion in 2022 and passenger numbers gradually increasing.
References
-
Statista. “Number of American Airlines Group Employees From FY 2012 to FY 2022.” Accessed on April 20, 2026.
-
American Airlines. “American Airlines Group.” Accessed on April 20, 2026.
-
Travel Awaits. “You’ll Face Fewer Delays if You Fly These 6 U.S. Airlines.” Accessed on April 20, 2026.
-
Forbes. “Forecast of the Day: American Airlines Average Occupancy Rate.” Accessed on April 20, 2026.
-
American Airlines. “American Airlines Reports Fourth-Quarter and Full-Year 2021 Financial Results.” Accessed on April 20, 2026.
-
American Airlines Newsroom. “AAdvantage Celebrates 40 Years of Loyalty Innovation.” Accessed on April 20, 2026.
-
Statista. “Domestic Market Share of Leading U.S. Airlines from January to December 2022.” Accessed on April 20, 2026.
-
Macroaxis. “American Current Valuation: American Airlines Gp.” Accessed on April 20, 2026.
-
Fortune. “Fortune 500: American Airlines Group.” Accessed on April 20, 2026.
-
Macrotrends. “American Airlines Group Revenue 2010-2022 | AAL.” Accessed on April 20, 2026.
-
Statista. “Number of Passengers Enplaned by American Airlines From FY 2014 to FY 2022.” Accessed on April 20, 2026.
-
Statista. “American Airlines Group’s Net Income/Loss From FY 2009 to FY 2022.” Accessed on April 20, 2026.
Author
Abby is a writer who is passionate about the power of story. Whether it’s communicating complicated topics in a clear way or helping readers connect with another person or place from the comfort of their couch. Abby attended Oral Roberts University in Tulsa, Oklahoma, where she earned a degree in writing with concentrations in journalism and business.