- Income Statistics
- Average PTO Days
- What Percentage of Americans Live Paycheck to Paycheck?
- Average American Income
- Millionaire Statistics
- Average Salary out of College
- Average Bonus Statistics
- Minimum Wage Statistics
- Union Benefits Statistics
- Savings Statistics
- Average Annual Raise
- Income Inequality Statistics
- How Many People Make Over 100k?
- Average 401(k) Sstatistics
- Average Net Worth Statistics
- $100k After-Tax Income By State
- Average Global Income
Find a Job You Really Want In
Research Summary: Understanding the average global income can be challenging, especially given the vast disparities between different countries and individuals. While the average can be influenced by extreme earners, it remains intriguing to explore these global statistics.
Here’s what our recent research has revealed:
-
The average global personal income is $12,235 per year.
-
The average global household income is $9,733 per year.
-
The median per-capita household income is approximately $2,920 per year.
-
To be among the top 10% of global earners, an individual must make over $100,000, while earning over $1 million places one in the top 1%.
For a more detailed analysis, we have categorized the data in the following sections:
Annual Income | Purchasing Power Parity | Global Income | GDP per Capita | Household Income
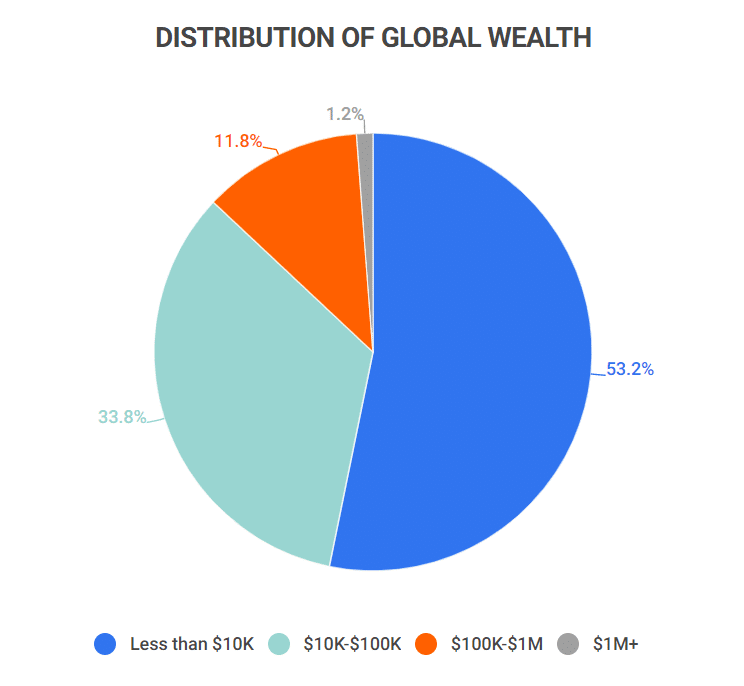
Distribution of Global Wealth
| Income | Share of global adults |
|---|---|
| <$10,000 | 53.2% |
| $10,000-$100,000 | 33.8% |
| $100,000-$1M | 11.8% |
| $1M+ | 1.2% |
Average Annual Income by Country
Average annual income varies significantly by country, with some nations exhibiting very low averages while others are exceedingly high. Here are some key findings from our research:
-
Monaco has the highest average annual income of $186,080.
This places the average Monaco citizen within the top 10% of earners globally. Other countries in the top five include: Bermuda ($122,470), Switzerland ($90,600), Luxembourg ($88,190), and Norway ($83,880).
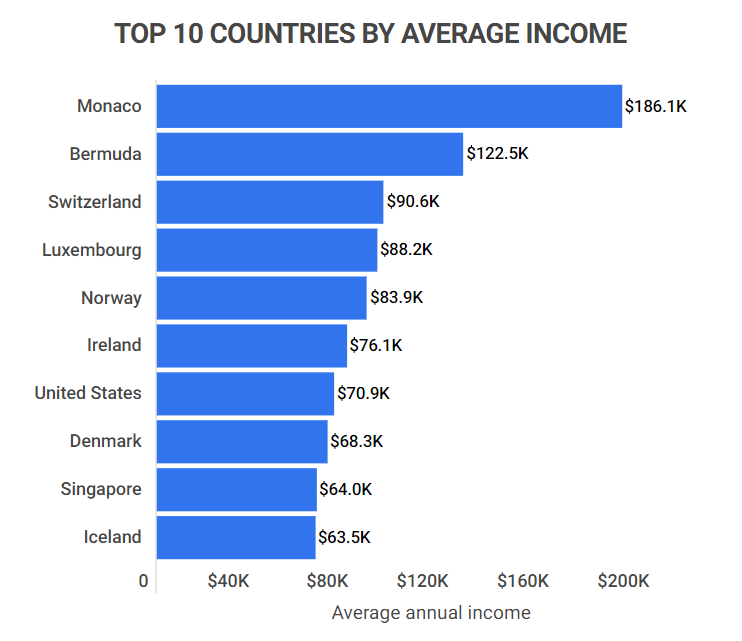
Top 10 Countries By Average Income
Country Average annual income Monaco $186,080 Bermuda $122,470 Switzerland $90,600 Luxembourg $88,190 Norway $83,880 Ireland $76,110 United States $70,930 Denmark $68,300 Singapore $64,010 Iceland $63,460 -
The US ranks as the country with the 7th highest average income globally.
This ranking may be influenced by the fact that over 30% of all billionaires reside in the US, while more than 28% of households earn less than $25,000 per year.
-
Burundi holds the record for the lowest average annual income at $220.
This translates to citizens earning only $18 monthly, which is less than a dollar daily. Other countries in the bottom five include: Afghanistan ($390), Somalia ($430), South Sudan ($460), and Mozambique ($480).
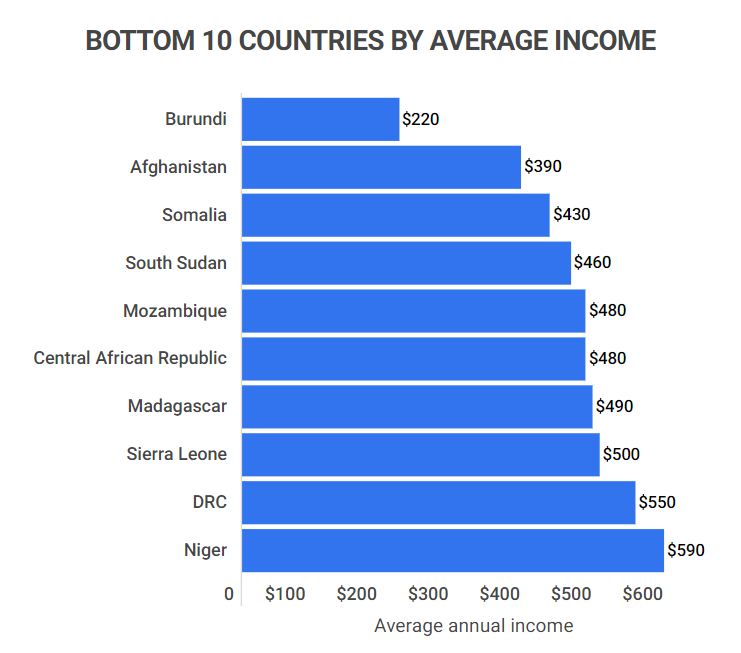
Bottom 10 Countries By Average Income
Country Average annual income Burundi $220 Afghanistan $390 Somalia $430 South Sudan $460 Mozambique $480 Central African Republic $480 Madagascar $490 Sierra Leone $500 DRC $550 Niger $590
Average Purchasing Power Parity (PPP) by Country
While the income disparities globally are striking, it’s crucial to recognize that average income alone doesn’t convey the complete picture. For example, a country with a higher average income may still have low purchasing power. Here are some notable statistics:
-
Luxembourg boasts the highest PPP by median annual income of $26,321.
PPP, or Purchasing Power Parity, is highest in Luxembourg, indicating that the wealthier-than-average citizens here also gain more from their income. Other countries with high PPP include: UAE ($24,292), Norway ($22,684), Switzerland ($21,490), and the United States ($19,306).
Top 10 Countries By Median Annual Income PPP
Country PPP (Purchasing power parity) Luxembourg $26,321 UAE $24,292 Norway $22,684 Switzerland $21,490 United States $19,306 Canada $18,652 Austria $18,405 Sweden $17,625 Denmark $17,432 Netherlands $17,154 -
DRC has the lowest PPP by median annual income of $395.
The DRC, one of Africa’s largest nations, continues to face significant poverty challenges. Other countries with low PPP include: Madagascar ($398), Burundi ($475), Malawi ($484), and Guinea-Bissau ($486).
Bottom 10 Countries By Median Annual Income PPP
Country PPP (Purchasing power parity) DRC $395 Madagascar $398 Burundi $475 Malawi $484 Guinea-Bissau $486 Central African Republic $491 Mozambique $529 Zambia $545 Uzbekistan $591 Rwanda $621 -
Luxembourg has the highest GDP per capita PPP of $133,330.
This indicates that Luxembourg not only has high average incomes but also produces significant economic output per person. Other countries with high GDP per capita PPP include: Singapore ($116,486), Ireland ($105,355), Qatar ($102,018), and Bermuda ($88,185).
Top 10 Countries By GDP per capita PPP
Country GDP per capita PPP Luxembourg $133,330 Singapore $116,486 Ireland $105,355 Qatar $102,018 Bermuda $88,185 Norway $80,535 Switzerland $77,121 UAE $76,609 Cayman Islands $74,155 United States $69,287 -
Burundi has the lowest GDP per capita PPP of $774.
Burundi continues to struggle with poverty, reflected in its low GDP per capita PPP. Other countries with low GDP per capita PPP include: Central African Republic ($920), DRC ($1,179), South Sudan ($1,182), and Somalia ($1,249).
Bottom 10 Countries By GDP per capita PPP
Country GDP per capita PPP Burundi $774 Central African Republic $920 DRC $1,179 South Sudan $1,182 Somalia $1,249 Niger $1,304 Mozambique $1,348 Liberia $1,564 Chad $1,566 Madagascar $1,608
Global Income Over Time
Despite ongoing challenges, global income has shown remarkable growth over the years. Here are key points illustrating this trend:
-
Average global income increased 2.7 times from 1950 to 2023.
The average income in 1950 was merely $3,300 per year, peaking at approximately $14,574 in 2016. As of 2026, the average global income stands at around $12,235 per year.
-
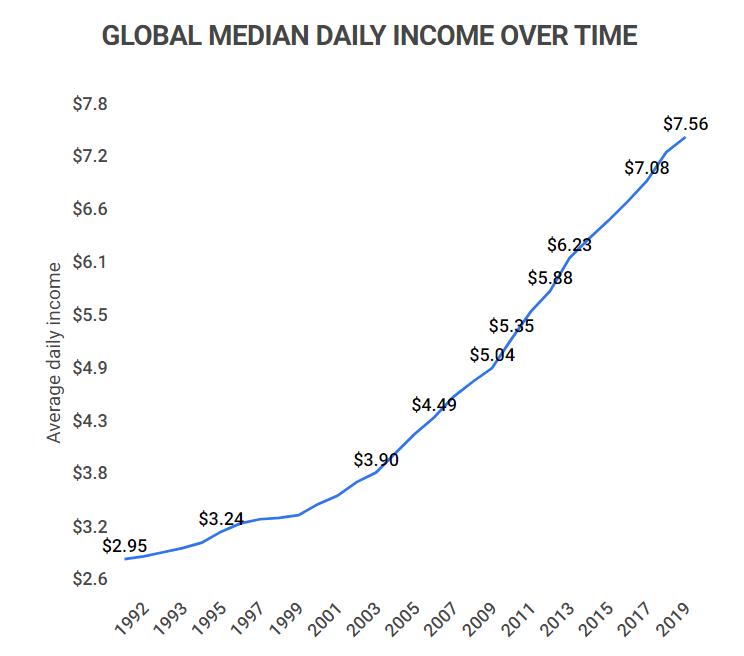
Global median daily income rose over 150% from 1990 to 2019.
In 1990, the global median daily income was only $2.95, increasing to $7.56 by 2019—a significant relative growth.
Global Median Daily Income Over Time
Year Median daily income 2019 $7.56 2018 $7.40 2017 $7.08 2016 $6.85 2015 $6.65 2014 $6.45 2012 $6.23 2011 $5.65 2010 $5.35 2009 $5.04 2008 $4.88 2007 $4.72 2006 $4.49 2005 $4.32 2004 $4.10 2003 $3.90 2002 $3.79 2001 $3.63 2000 $3.55 1999 $3.42 -
The income of the top 1% has grown 100 times faster than that of the bottom 50%.
In the last 50 years, the top 1% have seen an average wealth increase of $800,000—100 times more than that of earners in the bottom 50%.
GDP per Capita by Country
While GDP per capita differs from average income, it provides crucial insights into the economic performance of nations. Here’s how various countries compare:
-
Monaco has the highest GDP per capita of $234,315.
Monaco is among the wealthiest nations globally, with others in the top five including: Liechtenstein ($157,755), Luxembourg ($133,590), Bermuda ($114,090), and Ireland ($100,172).
Top 10 Countries By GDP per Capita
Country GDP per capita Monaco $234,315 Liechtenstein $157,755 Luxembourg $133,590 Bermuda $114,090 Ireland $100,172 Switzerland $91,992 Norway $89,154 Isle of Man $87,157 Cayman Islands $86,569 Channel Islands $75,153 -
Burundi has the lowest GDP per capita at just $221.
Burundi continues to rank poorly across multiple economic metrics, with others in the bottom five including: Afghanistan ($369), Somalia ($447), Central African Republic ($461), and Sierra Leone ($480).
Bottom 10 Countries By GDP per Capita
Country GDP per capita Burundi $221 Afghanistan $369 Somalia $447 Central African Republic $461 Sierra Leone $480 Mozambique $492 Madagascar $500 Syrian Arab Republic $533 DRC $577 Niger $591
Average Household Income by Country
Average household income is typically higher than personal income, as it reflects the combined income of multiple earners. Here’s a look at the countries with the highest and lowest household incomes:
-
Luxembourg has the highest average household income of $52,493.
Luxembourg leads in average household income, followed closely by Norway ($51,489), Sweden ($50,514), Australia ($46,555), and Denmark ($44,360).
Top 10 Countries by Average Household Income
Country Average household income Luxembourg $52,493 Norway $51,489 Sweden $50,514 Australia $46,555 Denmark $44,360 United States $43,585 Canada $41,280 Netherlands $38,584 Finland $34,615 Germany $33,333 -
Burundi has the lowest median household income of only $673.
Other countries with low household incomes include: Liberia ($781), Madagascar ($1,013), Rwanda ($1,101), and Zambia ($1,501).
Bottom 10 Countries by Average Household Income
Country GDP per capita Burundi $673 Liberia $781 Madagascar $1,013 Rwanda $1,101 Zambia $1,501 Benin $1,502 Burkina Faso $1,530 Togo $1,571 Mali $1,983 Sierra Leone $2,330
Global Income FAQ
-
What is the average income globally?
The average global income is $12,235 per year. This figure reflects individual contributions to a country’s economy, measured through GDP per capita. Average household income is another relevant metric, which stands at $9,733 per year.
-
What income qualifies as being in the top 1% worldwide?
To be in the top 1% globally, one must earn $1 million or more. In the US, the threshold is $1.697 million, which is comparable to the global standard.
Furthermore, a significant 87% of the global population earns less than $100,000 annually.
-
Which country has the highest average income in the world?
Monaco holds the highest average income at $186,080 per year. The country also leads with a GDP per capita of $234,315, marking it as one of the wealthiest nations globally.
Luxembourg frequently appears in these rankings as well, boasting the highest average household income of $52,493 and the highest PPP by median annual income of $26,321.
-
Which country has the lowest average income in the world?
Burundi consistently ranks as the country with the lowest average income, at just $220 per year. It ranks poorly across various economic indicators, including:
-
A GDP per capita PPP of $774
-
A GDP per capita of $221
-
A median household income of $673
Burundi’s closest competitor in low rankings is the DRC, which has a PPP by median annual income of only $395.
-
Conclusion
Measuring average income can be complex, ranging from household income to GDP per capita, and the disparities between countries are significant.
Nations such as Monaco and Luxembourg showcase some of the highest average incomes globally, often exceeding $100,000 per person. In stark contrast, countries like the DRC and Burundi continue to face severe poverty challenges.
Although the US ranks among the wealthiest nations, it holds the seventh-highest average annual income worldwide.
While there’s still much work to be done in addressing poverty, it’s crucial to acknowledge the progress made. From 1950 to 2023, average global income has increased 2.7 times, rising from $3,300 to $12,235 today.
References
-
Macrotrends – World GDP Per Capita 1960-2023
-
The World Bank – GDP per capita, PPP (current international $)
-
Our World in Data – Median income or consumption per day, 1990 to 2019
-
Salon – New data shows income of top 1% has grown 100 times faster than bottom 50% since 1970
- Income Statistics
- Average PTO Days
- What Percentage of Americans Live Paycheck to Paycheck?
- Average American Income
- Millionaire Statistics
- Average Salary out of College
- Average Bonus Statistics
- Minimum Wage Statistics
- Union Benefits Statistics
- Savings Statistics
- Average Annual Raise
- Income Inequality Statistics
- How Many People Make Over 100k?
- Average 401(k) Sstatistics
- Average Net Worth Statistics
- $100k After-Tax Income By State
- Average Global Income
Author
Jack Flynn is a writer for Zippia. In his professional career he’s written over 100 research papers, articles and blog posts. Some of his most popular published works include his writing about economic terms and research into job classifications. Jack received his BS from Hampshire College.


