- Facts and Figures
- Social Security Statistics
- Social Media Statistics
- Cell Phone Usage Statistics
- Cryptocurrency Statistics
- White Collar Crime Statistics
- Crowdfunding Statistics
- Branding Statistics
- How Many Emails Are Sent Per Day
- Money Laundering Statistics
- Childcare Availability Statistics
- Cold Calling Statistics
- Automation And Job Loss Statistics
- Student Loan Statistics
- Spam Statistics
- Password Statistics
- Ransomware Statistics
- Christmas Spending Statistics
- Average Grocery Cost By State
- Average Screen Time Statistics
- Average Monthly Expenses
- IoT Statistics
- Gen Z Statistics
DOCTYPE html
Research Summary: Have you ever considered the amount of time you dedicate to screens daily? With our reliance on devices for work, news, and entertainment, the average time spent in front of screens may be surprising.
To better understand average screen time in the US, we’ve compiled an extensive list of pertinent statistics. From our research:
-
The average American spends 7 hours and 4 minutes on screens each day.
-
Globally, the average screen time is 6 hours and 58 minutes per day.
-
Americans spend roughly 3 hours and 43 minutes on their phones daily.
-
Experts recommend limiting screen time to under 2 hours per day.
-
Daily screen time peaked at 7.7 hours during the height of the pandemic but has stabilized since then.
For further analysis, we categorize the data as follows:
Device | Age | Location | Health
Screen Time by Device Statistics
Various factors contribute to our screen time, whether it’s getting lost in a three-hour TikTok session or gaming for one more round. Different devices can significantly influence our overall screen time. For instance:
-
Americans spend 34% of their screen time watching TV.
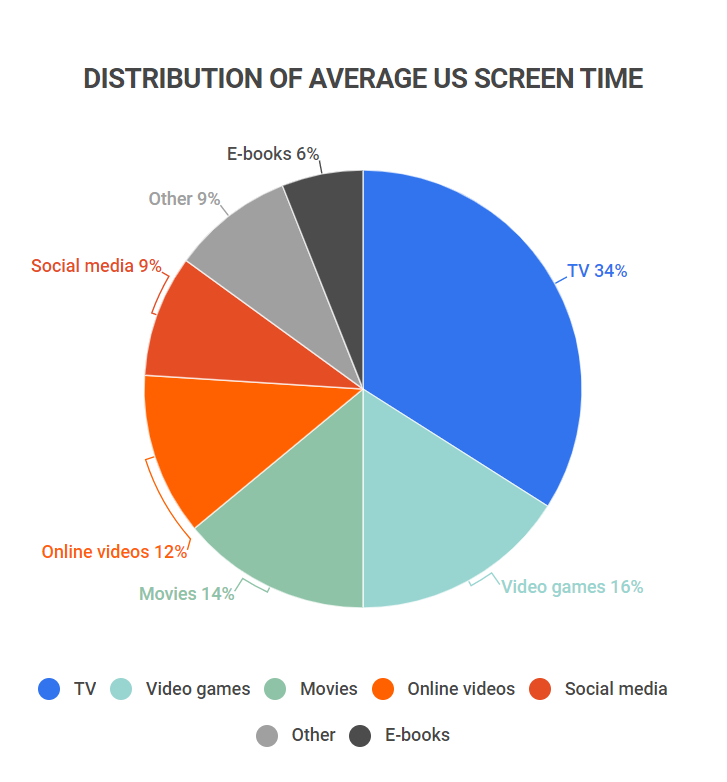
This percentage has decreased, yet it remains significantly higher than any other activity, with only 16% of screen time spent on video games and 14% on movies.
Distribution of American Screen Time
Activity Share of total screen time TV 34% Video games 16% Movies 14% Online videos 12% Social media 9% Other 9% E-books 6% -
The average American teen spends 3 hours and 16 minutes per day watching TV and videos.
Television remains the dominant medium for younger generations, alongside significant time spent on gaming and social media.
Hourly Distribution of Screen Time For American Teens
Activity Hours of screen time per day TV and videos 3 hours 16 mins Video games 1 hour 46 mins Social media 1 hour 27 mins Browsing websites 51 mins Other 29 mins Video chatting 20 mins E-books 15 mins Content creation 14 mins -
Globally, people spend an average of 3 hours and 30 minutes on their phones daily.
This is slightly lower than the American average of 3 hours and 43 minutes, yet it still reflects that individuals spend nearly 15% of their day on their phones worldwide.
-
60.28% of all internet traffic originates from mobile devices.
This represents a remarkable increase from 2013, when only 17% of internet traffic was mobile. The steady growth continued, particularly during the pandemic, as remote work surged.
Mobile Internet Traffic Over Time
Year Share of total internet traffic 2013 17.02% 2014 28.97% 2015 37.24% 2016 45.91% 2017 54.09% 2018 53.01% 2019 52.26% 2020 53.07% 2021 56.53% 2022 59.40% 2023 60.28% -
Users average 45.8 minutes daily on TikTok.
TikTok leads among social media platforms, while YouTube closely follows with an average of 45.6 minutes.
Average Screen Time By Social Media App
Social media app Average daily screen time TikTok 45.8 mins YouTube 45.6 mins Twitter 34.8 mins Snapchat 30.4 mins Facebook 30.1 mins Instagram 30.1 mins Reddit 23.8 mins
Average Screen Time by Age
Screen time tends to be higher among younger demographics. Here’s a closer look at the correlation between age and screen time:
-
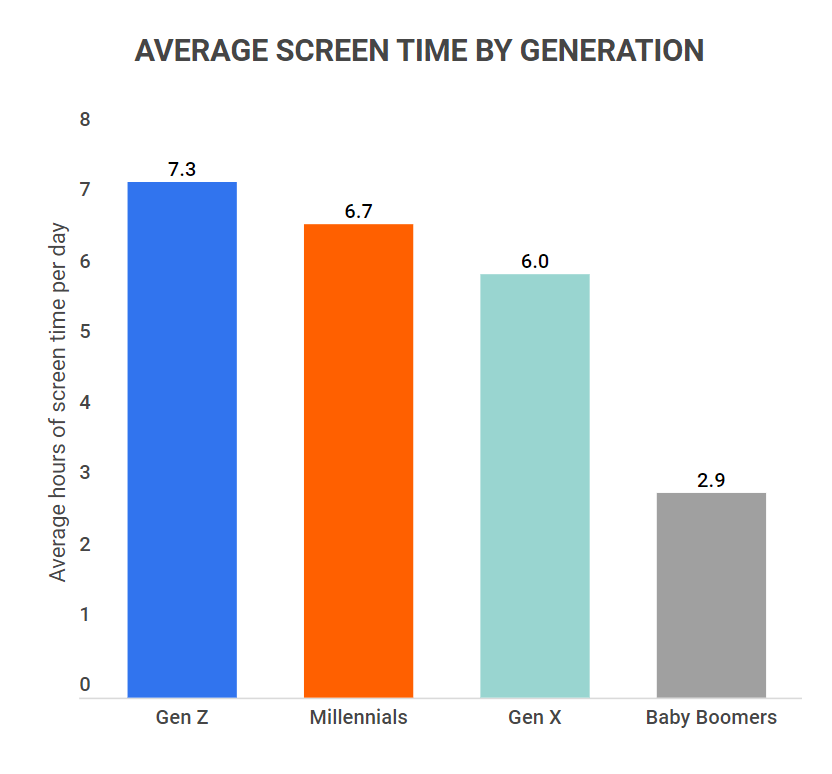
Gen Z averages 7 hours and 18 minutes of screen time daily.
In contrast, Baby Boomers average only 2 hours and 54 minutes.
Average Screen Time By Generation
Generation Average daily screen time Gen Z 7 hours 18 mins Millennials 6 hours 42 mins Gen X 6 hours Baby Boomers 2 hours 54 mins Silent Generation 2 hours 48 mins -
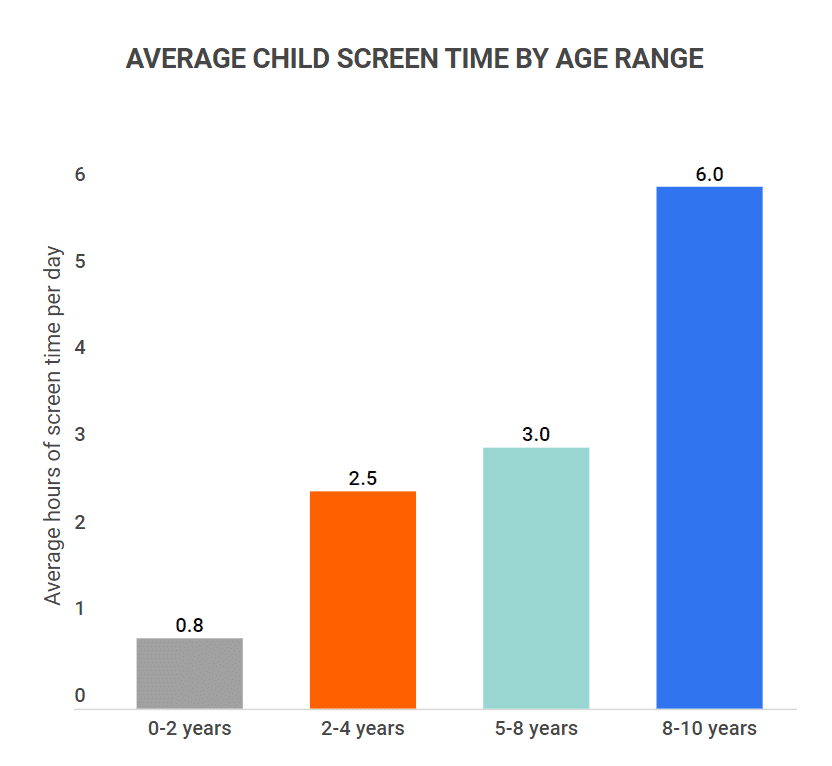
Children aged 8-10 average 8 hours of screen time per day.
Even infants aged 0-2 have close to an hour of screen time daily.
Child Screen Time By Age
Age range Average daily screen time 0-2 years 49 mins 2-4 years 2 hours 30 mins 5-8 years 3 hours 8-10 years 6 hours -
Average childhood screen time notably increased during the pandemic.
Prior to the pandemic, children averaged 2 hours and 42 minutes of screen time, which surged to 4 hours and 6 minutes during lockdowns.
Average Screen Time by Location
Screen time habits vary significantly across countries. For instance, rural areas typically exhibit lower screen time than urban centers. Here are some notable facts:
-
South Africa leads with an average screen time of 10 hours and 46 minutes per day.
This trend is mirrored by other countries in the top five:
Top 5 Countries By Average Daily Screen Time
Country Average daily screen time South Africa 10 hours 46 mins Philippines 10 hours 27 mins Brazil 10 hours 19 mins Colombia 10 hours 3 mins Argentina 9 hours 38 mins -
The Philippines has the highest mobile screen time, averaging 5 hours and 47 minutes daily.
Mobile usage dominates screen time in the Philippines, followed by the following countries:
Top 5 Countries By Average Daily Mobile Screen Time
Country Average daily screen time Philippines 5 hours 47 mins Thailand 5 hours 28 mins Brazil 5 hours 25 mins South Africa 5 hours 9 mins Colombia 5 hours 9 mins -
South Africa also has the highest average computer screen time, at 5 hours and 37 minutes per day.
Despite the global trend of lower computer usage relative to mobile, South Africa shows a different pattern:
Top 5 Countries By Average Daily Computer Screen Time
Country Average daily screen time South Africa 5 hours 37 mins Brazil 4 hours 54 mins Colombia 4 hours 54 mins Philippines 4 hours 40 mins Portugal 4 hours 22 mins
Screen Time and Health Statistics
Given that experts recommend a maximum of 2 hours of screen time per day, it’s essential to examine the health implications:
-
Children aged 6-17 should ideally limit screen time to 1-2 hours daily.
Experts advise no screen time for children under two, yet on average, they already have about an hour of screen time daily, while older children far exceed these recommendations.
-
87% of children surpass recommended screen time limits.
This excessive usage can lead to serious issues such as obesity, insomnia, chronic pain, anxiety, and lower academic performance.
Screen Time FAQ
-
What is the average screen time per day?
The average daily screen time for Americans is 7 hours and 4 minutes. Globally, it stands at 6 hours and 58 minutes. Screen time is typically balanced between mobile and computer use, with many regions reporting higher mobile usage.
Despite experts recommending only 2 hours of screen time per day, the average American exceeds this by nearly fourfold.
-
How much screen time is too much?
Experts suggest no more than 2 hours of screen time per day is healthy. For children aged 6-17, the guideline is 1-2 hours, while children under 6 should ideally have zero or significantly limited screen time.
Excessive screen time can lead to a variety of health issues, including:
- Headaches
- Blurry vision
- Brain fog
- Eye strain
- Sleep disturbances
- Behavioral issues
- Problems with cognitive skills
- Obesity
- Chronic pain
- Mental health challenges
-
What is the average screen time for teenagers?
Teenagers in the US average over 9 hours of screen time daily. This figure is concerning as it contributes to rising rates of mental health issues, sleep disorders, and other chronic health conditions.
Younger children, particularly those aged 8-10, also average at least 6 hours of daily screen exposure.
-
What is the average screen time by age?
Screen time generally decreases with age. For example, Gen Z averages 7 hours and 18 minutes, while Baby Boomers average only 2 hours and 54 minutes.
Generation Average daily screen time Gen Z 7 hours 18 mins Millennials 6 hours 42 mins Gen X 6 hours Baby Boomers 2 hours 54 mins Silent Generation 2 hours 48 mins -
What counts as screen time?
Screen time refers to any time spent in front of a digital screen. This includes mobile phone use, but also encompasses television viewing, gaming, and other activities. Here are some additional examples:
- TV
- Video games
- Movies
- Online videos
- Social media
- Other digital interaction
- E-books
Conclusion
In the US and globally, screen time continues to rise. Despite awareness of the potential downsides of excessive screen exposure, the average individual still spends nearly four times the recommended amount.
The average screen time in the US exceeds 7 hours per day, with teens clocking in up to 9 hours. This level of screen engagement can negatively impact both physical and mental health.
Experts recommend maintaining screen time under 2 hours a day, encompassing all forms of digital interaction. Adhering to these guidelines can yield significant health benefits.
References
-
USA Today – Screen time among teenagers during COVID more than doubled outside of virtual school, study finds
-
Marketing Charts – Americans’ Screen Time Activities Evolve Away from TV & Movies
-
Oberlo – Average Time Spent on Social Media in 2022 (by Platform)
-
Pew Research Center – Children’s engagement with digital devices, screen time
-
Medscape – Children’s Daily Screen Time Jumped 52% During Pandemic
-
Comparitech – Screen Time Statistics: Average Screen Time in US vs. the rest of the world
-
University of Albany – Research Spotlight: Study Finds Children Log Excessive Screen-Time
- Facts and Figures
- Social Security Statistics
- Social Media Statistics
- Cell Phone Usage Statistics
- Cryptocurrency Statistics
- White Collar Crime Statistics
- Crowdfunding Statistics
- Branding Statistics
- How Many Emails Are Sent Per Day
- Money Laundering Statistics
- Childcare Availability Statistics
- Cold Calling Statistics
- Automation And Job Loss Statistics
- Student Loan Statistics
- Spam Statistics
- Password Statistics
- Ransomware Statistics
- Christmas Spending Statistics
- Average Grocery Cost By State
- Average Screen Time Statistics
- Average Monthly Expenses
- IoT Statistics
- Gen Z Statistics
Author
Jack Flynn is a writer for Zippia. In his professional career he’s written over 100 research papers, articles and blog posts. Some of his most popular published works include his writing about economic terms and research into job classifications. Jack received his BS from Hampshire College.