- Industry Statistics
- Wedding Industry Statistics
- Yoga Industry Statistics
- Music Industry Statistics
- Landscaping Industry Statistics
- Bicycle Industry Statistics
- Coffee Industry Statistics
- Car Rental Industry Statistics
- Home Improvement Industry Statistics
- Insurance Industry Statistics
- Supplements Industry Statistics
- Golf Industry Statistics
- Fitness Industry Statistics
- US Media And Entertainment Industry Statistics
- Firearm Industry Statistics
- Financial Services Industry Statistics
- Health And Wellness Industry Statistics
- Trucking Industry Statistics
- Wine Industry Statistics
- Pet Industry Statistics
- Mobile App Industry Statistics
- Digital Marketing Industry Statistics
- Hotel Industry Statistics
- Retail Statistics
- Robotics Industry Statistics
- Jewelry Industry Statistics
- Appointment Scheduling statistics
- Restaurant Industry Statistics
- Food Delivery Statistics
- Food Truck Industry
- Fashion Industry
- Real Estate Industry
- US Film Industry
- US Beverage Industry
- USu202fFast Food Restaurants
- US Construction Industry
- US Book Industry
- Cosmetics Industry
- US Food Retail Industry
- US Pharmaceutical Industry
- US Healthcare Industry
- Airline Industry
- Automobile Industry
- Transportation Industry Statistics
- Event Industry Statistics
- Project Management Statistics
- Oil And Gas Industry Statistics
- Nursing Home Statistics
- Nursing Shortage Statistics
- Nursing Statistics
25+ Bicycle Industry Statistics [2026]: Bicycle Market Size, Share, Growth, And Trends
Research Summary: Bicycles have become a vital part of commuting and recreational activities across the United States. The bicycle industry continues to experience remarkable growth, adapting to changing consumer preferences and technological advancements. Below are key statistics regarding the bicycle industry:
-
The market size by revenue of the bicycle industry is estimated to be approximately $7.5 billion.
-
Ebike market sales grew by 300% from 2021 to 2022.
-
20-25 million bikes were sold in 2023.
-
400,000 bicycles are produced daily.
-
The United States bike industry CAGR for 2023 to 2028 is 6.8%.
For a deeper analysis, we divided the data into the following categories:
Consumers | Bikes | Trends | Projections | Global

General Bicycle Industry Statistics
-
40% of specialty bike shops were closed or consolidated between 2000 and 2022.
This trend is expected to have continued at a rate of 4-5% annually, indicating there are currently around 2,800 to 3,200 specialty bike shops in the U.S.
-
The global market size of the bike industry is projected to be $75 billion in 2026.
The bike industry holds a significant share of the global economy and continues to expand, attracting both enthusiasts and investors.
-
Approximately 8,000 bicycle shops exist in the United States.
This total includes around 3,200 specialty bike shops alongside large chain stores and outdoor recreation shops that carry bicycles. Additionally, there is a growing trend of brand-specific bike stores.
U.S. Bicycle Industry Statistics by Consumers
-
There are 60 million bicycle riders in the U.S.
While most riders engage in recreational cycling, a growing number are commuting to work, and outdoor cycling in non-paved terrains is also on the rise.
-
In 2023, Americans spent $10 billion on bicycles and accessories.
This reflects an increase from 2021, when consumers spent approximately $8.2 billion.
-
Americans spent $1 billion on bicycle equipment.
Bicycle equipment and accessories significantly contribute to industry revenue as consumers frequently upgrade or replace bicycle parts.
-
65% of cyclists in the United States are men, while 35% are women.
This marks an increase from 30% female cyclists in 2022, indicating ongoing efforts to bridge the gender gap in cycling.
U.S. Bicycle Industry Statistics by Bikes
-
90% of bikes in the U.S. were imported from China as of 2023.
China remains the leading exporter, with Taiwan being the second-largest source of bicycles. Recent shifts in trade dynamics have also influenced these figures.
-
The average price of a mass-produced bike is between $150 and $400.
High-end specialty bikes can still range in the thousands, but the average price remains accessible, contributing to market growth.
-
Over 250 bike brands are present in the U.S. market.
This market features both major brands that dominate sales and numerous smaller brands that offer diversity in the bicycle industry.
-
Trek Bikes holds the largest market share in the U.S. at 23%.
Following Trek are Giant Bicycle (11%), Specialized Bicycle Components, Inc. (10%), Redline (6.5%), and Raleigh (5.5%).
-
There are over 110 million bicycles in the U.S.
This averages about two bikes per rider, suggesting many bicycles are not in regular use, while some users possess multiple bikes for different purposes.
Bicycle Market Share By Brand
| Brand | Market Share |
|---|---|
| Trek Bikes | 23% |
| Giant Bicycle | 11% |
| Specialized Bicycle Components, Inc. | 10% |
| Redline | 6.5% |
| Raleigh | 5.5% |
| Haro Bicycles | 4% |
| Electra Bicycle Company | 3.5% |
| Cannondale | 3% |
| Sun Bicycles | 2.5% |
| Schwinn | 2% |
Bicycle Industry Trends
-
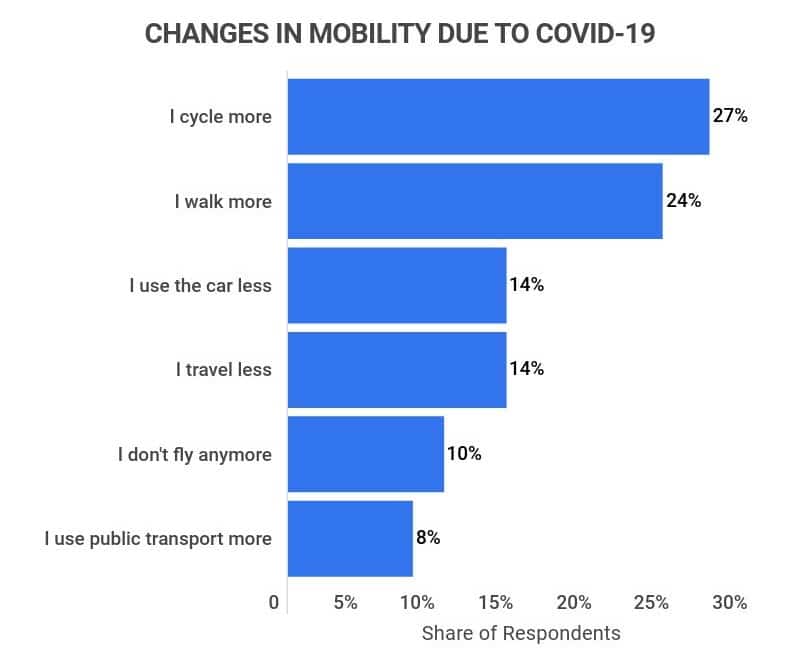
Bicycle sales increased by 50% between 2020 and 2021.
This surge was largely influenced by a post-pandemic shift in consumer behavior favoring outdoor activities.
-
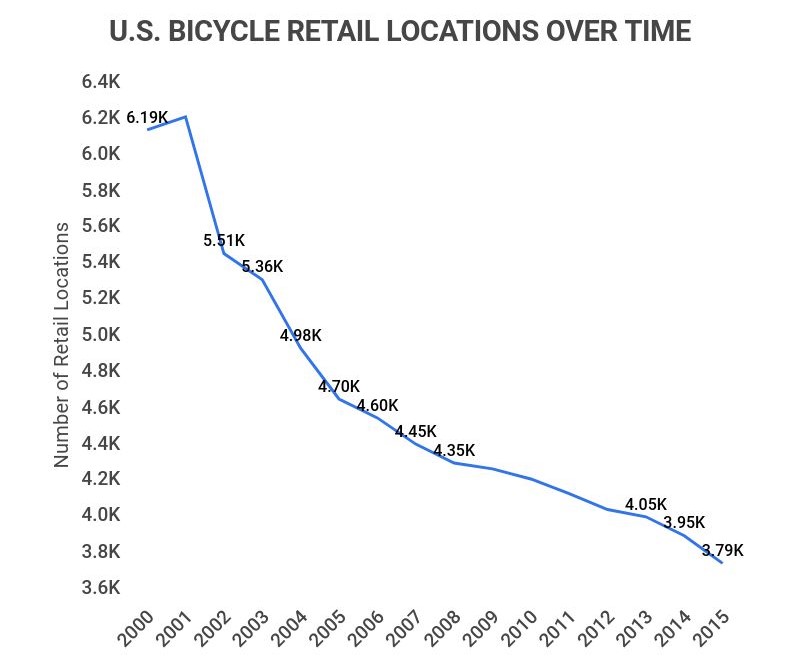
Bike-specific shops declined from 6,195 in 2000 to 3,600 in 2022.
The decline in specialty bike shops continues due to the rise of large retailers and online shopping.
-
Bicycle sales increased by 60% from 2021 to 2022.
This growth is attributed to a sustained interest in cycling, with many anticipating the trend to continue.
-
An estimated 22 million bicycles were sold in the U.S. in 2022.
Market trends suggest that sales figures could remain robust in the coming years.
-
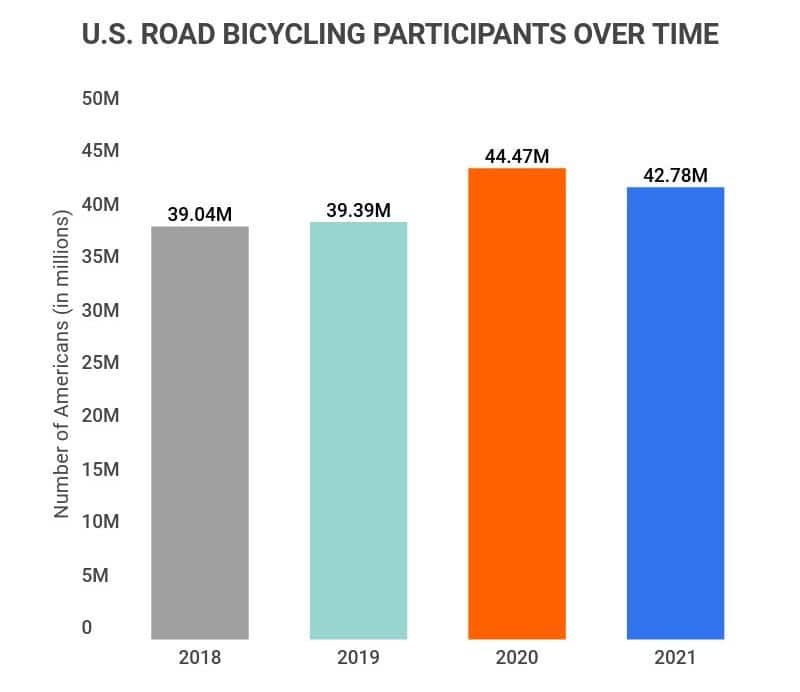
The number of bicycle riders increased in the U.S. from about 52 million in 2022 to 60 million in 2023.
This growth in ridership indicates a positive outlook for the bicycle industry.
Bicycle Industry Projections
-
By 2026, global sales of e-bikes are projected to reach $30 billion.
The e-bike segment is one of the fastest-growing areas in the bicycle market and is expected to dominate due to increased convenience and affordability.
-
By 2029, the global bicycle market could reach $100 billion.
Factors such as urbanization, rising living costs, and a shift towards eco-friendly transportation options will drive this growth.
Global Bicycle Industry Statistics
-
There are approximately 1.5 billion bicycles worldwide.
The top three countries with the highest number of bicycles are:
Country Bicycles (millions) China 500 United States 110 India 80 -
European countries lead in bicycles per capita.
The top three countries with bicycles per capita are:
Country Bicycles owned (% of the population) Netherlands 99% Denmark 82% Germany 78% Country Cyclists Population Bicycles Netherlands 99.20% 17,000,000 16,800,000 Denmark 81.50% 5,800,000 4,800,000 Germany 76.50% 83,200,000 64,000,000 Sweden 64.30% 10,200,000 6,500,000 Norway 62.00% 5,200,000 3,200,000 -
Minneapolis was named the most bike-friendly city in the U.S. in 2022.
The top five bike-friendly cities in the U.S. are:
Bicycle Industry Statistics FAQ
-
How much is the bicycle industry worth?
The global bicycle industry was valued at over $75 billion in 2026, with the United States value estimated at over $7.5 billion. Experts predict that this industry will continue to grow at a significant rate both domestically and globally.
In the United States, the CAGR from 2023 to 2028 is expected to be 6.8%. Globally, the CAGR from 2023 to 2029 is projected at 8.5%.
Factors contributing to the size of this industry include improved technology that enhances the convenience of purchasing, maintaining, and using bicycles. Social media platforms and GPS tracking have fostered vibrant online cycling communities.
The growing culture of cycling for recreation, fitness, and sustainability, along with increasing urbanization and rising fuel costs, makes cycling a preferred commuting option.
-
How many bicycles are produced each year?
Approximately 110 million bicycles are produced annually. The manufacturing process has greatly improved due to globalization and advancements in production technology.
Bicycles are produced globally, with the majority manufactured in China, but various components are sourced from multiple countries.
-
How many bike shops are there in the U.S.?
There are over 8,000 locations in the U.S. that sell bicycles. Around 3,200 of these stores specialize in bicycles, while the remainder are large chain stores offering outdoor recreation products.
Many consumers prefer purchasing bikes in physical stores to test them before buying, although online retail is gaining popularity.
-
What company sells the most bicycles?
Trek/Fisher and Giant are the leading bicycle brands in the U.S. Both companies possess significant market shares, with Trek at 23% and Giant at 11%. Other notable brands include Scott, Cannondale, and Specialized.
-
In what country is cycling most popular?
The Netherlands is recognized as the most bicycle-friendly country. Due to high population density, investment in cycling infrastructure, and a cultural preference for biking, almost everyone in the Netherlands owns a bicycle, boasting a per capita ownership rate of approximately 99%.
-
Who is the biggest bicycle manufacturer in the world?
The largest bicycle manufacturer globally is Giant. Known for producing over 6 million units annually, Giant benefits from a concentrated manufacturing base, giving it a competitive edge over companies relying on diverse production locations.
-
Is the bicycle industry growing?
Yes, the bicycle industry is experiencing significant growth. The U.S. alone is witnessing millions of new cyclists annually. The industry’s growth rate has attracted considerable attention from investors, solidifying bicycles as a lasting presence in transportation.
-
What trends are currently affecting the bicycle industry?
Several trends are influencing the bicycle sector. Technological advancements have lowered entry costs and introduced convenient accessories to the cycling community. Improvements in technology have also made it easier for consumers to find suitable bicycles at affordable prices.
Other trends include increasing urbanization, which has resulted in environments where cycling is a practical commuting option. Rising fuel costs and a growing awareness of sustainable living are further impacting the bicycle industry.
More consumers are seeking ways to reduce both their expenses and carbon footprints, with cycling providing a viable solution to these challenges.
Conclusion
The bicycle industry is a dynamic sector that both consumers and investors should closely monitor. The market continues to expand, with significant growth observed between 2022 and 2023.
Bicycles offer an economical solution for individuals seeking recreational or commuting options. The rise of bicycle commuting is increasingly evident in American cities, which are investing in infrastructure to support this trend.
With these developments, bicycles are poised to remain a cornerstone of transportation in the U.S.
References
-
Statista. “U.S. Bicycle Industry – Statistics & Facts.” Accessed April 9, 2022.
-
NPD. “The Cycling Market Pedals Ahead in 2021.” Accessed April 9, 2022.
-
Mordor Intelligence. “NORTH AMERICA BICYCLE MARKET – GROWTH, TRENDS, COVID-19 IMPACT, AND FORECASTS (2022 – 2027).” Accessed April 9, 2022.
-
National Bicycle Dealers Association. “Bicycle Industry Overview 2015.” Accessed April 9, 2022.
-
Bicycle Retailer. “Just How Many Bike Shops Are There, Anyway?” Accessed April 9, 2022.
-
Statista. “Number of participants in bicycling in the United States from 2006 to 2020.” Accessed April 9, 2022.
-
Statista. “Pandemic-Fueled Bicycle Boom Coasts Into 2021.” Accessed April 9, 2022.
-
Taylor & Francis Online. “Cycling Behaviour in 17 Countries Across 6 Continents: Levels of Cycling, Who cycles, For What purpose, and How Far?” Accessed April 9, 2022.
-
Reuters. “U.S. bike firms face uphill slog to replace Chinese supply chains.” Accessed April 9, 2022.
-
Statista. “Cycling – Statistics & Facts.” Accessed April 9, 2022.
-
National Bicycle Dealers Association. “The Future of the Bicycle Industry.” Accessed April 9, 2022.
-
Statista. “Number of specialty bicycle retail locations in the U.S. from 2000 to 2015.” Accessed April 9, 2022.
-
Discerning Cyclist. “Which City Has the Most Cyclists?” Accessed April 9, 2022.
-
Redfin News. “Top 10 U.S. Cities for Biking in 2020.”
-
BBC. “How is a Bicycle Made?” Accessed April 9, 2022.
- Industry Statistics
- Wedding Industry Statistics
- Yoga Industry Statistics
- Music Industry Statistics
- Landscaping Industry Statistics
- Bicycle Industry Statistics
- Coffee Industry Statistics
- Car Rental Industry Statistics
- Home Improvement Industry Statistics
- Insurance Industry Statistics
- Supplements Industry Statistics
- Golf Industry Statistics
- Fitness Industry Statistics
- US Media And Entertainment Industry Statistics
- Firearm Industry Statistics
- Financial Services Industry Statistics
- Health And Wellness Industry Statistics
- Trucking Industry Statistics
- Wine Industry Statistics
- Pet Industry Statistics
- Mobile App Industry Statistics
- Digital Marketing Industry Statistics
- Hotel Industry Statistics
- Retail Statistics
- Robotics Industry Statistics
- Jewelry Industry Statistics
- Appointment Scheduling statistics
- Restaurant Industry Statistics
- Food Delivery Statistics
- Food Truck Industry
- Fashion Industry
- Real Estate Industry
- US Film Industry
- US Beverage Industry
- USu202fFast Food Restaurants
- US Construction Industry
- US Book Industry
- Cosmetics Industry
- US Food Retail Industry
- US Pharmaceutical Industry
- US Healthcare Industry
- Airline Industry
- Automobile Industry
- Transportation Industry Statistics
- Event Industry Statistics
- Project Management Statistics
- Oil And Gas Industry Statistics
- Nursing Home Statistics
- Nursing Shortage Statistics
- Nursing Statistics
Author
Conor McMahon is a writer for Zippia, with previous experience in the nonprofit, customer service and technical support industries. He has a degree in Music Industry from Northeastern University and in his free time he plays guitar with his friends. Conor enjoys creative writing between his work doing professional content creation and technical documentation.