Find a Job You Really Want In

As we move into 2026, the impact of the COVID-19 pandemic on health insurance coverage remains a significant topic. Nearly 40 million workers lost their jobs during the pandemic, leading to widespread health insurance loss.
While many jobs have returned, the landscape of employment has changed dramatically, with some positions permanently eliminated. Workers who were furloughed discovered that their job losses were not as temporary as they had hoped.
The CARES ACT provided essential financial assistance, but many individuals found themselves abruptly without health insurance coverage.
The average annual COBRA family premium, previously reported at $1,595, continues to pose a financial challenge for many families. As of May 2020, over 5.3 million workers had lost their employer-provided health insurance, with varying impacts across states.
In this article, we present the total number of newly uninsured individuals in each state, the percentage increase in uninsured rates, and the current percentage of total uninsured in each state.
You can jump to the full list, or continue reading to discover which states were hit the hardest.
The 10 States With The Largest Increase In Uninsured
- Massachusetts
- Hawaii
- Rhode Island
- Michigan
- New Hampshire
- Vermont
- Nevada
- Delaware
- New York
- Connecticut
Northeastern states experienced the most significant increases in uninsured residents, with Massachusetts leading at a staggering 93% rise in uninsured adults due to job losses linked to COVID-19. All states in the top ten recorded increases exceeding 30%.
How We Determined This
Our data is sourced from Families USA, a respected nonprofit organization.
Three figures for each state are displayed throughout this article:
- Increase in Uninsured Adults
- Uninsured Rate in May 2020
- Number of Newly Uninsured
To assess the increase in uninsured adults, we extrapolated state-level increases in unemployment and coverage estimates to estimate the insurance drop for each state. This figure was then compared to the 2018 ACS uninsured rate, the most recent data available at that time.
It’s important to note that these numbers reflect changes from February to May 2020 and do not include workers who lost their insurance after May. This means that individuals who lost their jobs and insurance from June 1st onward are not accounted for in these figures, nor are dependents who lost coverage when the primary policyholder lost insurance.
Here is a summary of the 10 states that saw the largest increases in uninsured rates. You can also navigate to the bottom of the article to view the standing of every state.
1. Massachusetts

Increase in Uninsured Adults: 93%
Uninsured Rate in May 2020: 8%
Number of Newly Uninsured: 159,000
2. Hawaii

Increase in Uninsured Adults: 72%
Uninsured Rate in May 2020: 10%
Number of Newly Uninsured: 34,000
3. Rhode Island

Increase in Uninsured Adults: 55%
Uninsured Rate in May 2020: 9%
Number of Newly Uninsured: 21,000
4. Michigan
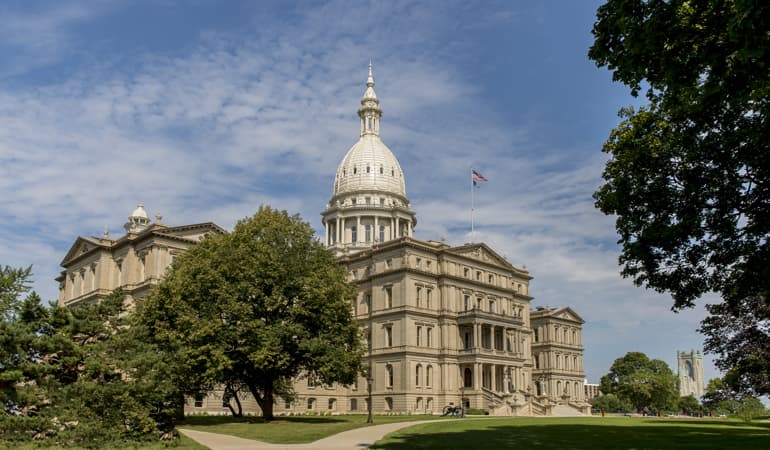
Increase in Uninsured Adults: 46%
Uninsured Rate in May 2020: 12%
Number of Newly Uninsured: 222,000
5. New Hampshire

Increase in Uninsured Adults: 43%
Uninsured Rate in May 2020: 11%
Number of Newly Uninsured: 29,000
6. Vermont

Increase in Uninsured Adults: 36%
Uninsured Rate in May 2020: 7%
Number of Newly Uninsured: 7,000
7. Nevada

Increase in Uninsured Adults: 34%
Uninsured Rate in May 2020: 21%
Number of Newly Uninsured: 97,000
8. Delaware

Increase in Uninsured Adults: 33%
Uninsured Rate in May 2020: 11%
Number of Newly Uninsured: 16,000
9. New York

Increase in Uninsured Adults: 32%
Uninsured Rate in May 2020: 10%
Number of Newly Uninsured: 298,000
10. Connecticut

Increase in Uninsured Adults: 30%
Uninsured Rate in May 2020: 10%
Number of Newly Uninsured: 49,000
Over 5.3 Million Workers Lost Their Insurance
The loss of health insurance has left over 5.3 million workers in a precarious position regarding access to healthcare. This situation increases the likelihood of delaying treatment for COVID-19 and makes managing ongoing health issues challenging.
While the ten states highlighted above experienced the largest increases in uninsured adults, many other states also report alarmingly high uninsured rates, even during more stable times.
In several states, over 20% of adults are uninsured, including Texas (29%), Florida (25%), Oklahoma (24%), Georgia (23%), Mississippi (22%), Nevada (21%), North Carolina (20%), and South Carolina (20%). Many of these states have been grappling with surges in COVID-19 cases.
The current U.S. healthcare system, which ties benefits to employment, continues to link economic downturns with declines in health insurance coverage.
How much did the uninsured increase due to COVID in each state?
| Rank | State | Increase In Uninsured Adults | Uninsured In May 2020 | Number Of Newly Uninsured |
|---|---|---|---|---|
| 1 | Massachusetts | 93% | 8% | 159,000 |
| 2 | Hawaii | 72% | 10% | 34,000 |
| 3 | Rhode Island | 55% | 9% | 21,000 |
| 4 | Michigan | 46% | 12% | 222,000 |
| 5 | New Hampshire | 43% | 11% | 29,000 |
| 6 | Vermont | 36% | 7% | 7,000 |
| 7 | Nevada | 34% | 21% | 97,000 |
| 8 | Delaware | 33% | 11% | 16,000 |
| 9 | New York | 32% | 10% | 298,000 |
| 10 | Connecticut | 30% | 10% | 49,000 |
| 11 | Iowa | 29% | 9% | 38,000 |
| 12 | Minnesota | 28% | 8% | 56,000 |
| 13 | California | 27% | 13% | 689,000 |
| 14 | Florida | 24% | 25% | 607,000 |
| 15 | North Carolina | 24% | 20% | 238,000 |
| 16 | Maryland | 24% | 11% | 75,000 |
| 17 | Washington | 23% | 12% | 103,000 |
| 18 | Illinois | 23% | 13% | 186,000 |
| 19 | Wisconsin | 22% | 10% | 62,000 |
| 20 | Pennsylvania | 22% | 10% | 137,000 |
| 21 | Ohio | 21% | 11% | 139,000 |
| 22 | New Jersey | 21% | 13% | 124,000 |
| 23 | South Carolina | 20% | 20% | 99,000 |
| 24 | Kansas | 20% | 15% | 43,000 |
| 25 | Colorado | 20% | 13% | 74,000 |
| 26 | Missouri | 19% | 17% | 100,000 |
| 27 | Tennessee | 19% | 19% | 122,000 |
| 28 | Oregon | 18% | 13% | 50,000 |
| 29 | South Dakota | 18% | 16% | 12,000 |
| 30 | Kentucky | 18% | 10% | 40,000 |
| 31 | Indiana | 17% | 13% | 79,000 |
| 32 | West Virginia | 17% | 12% | 18,000 |
| 33 | Oklahoma | 16% | 24% | 77,000 |
| 34 | Maine | 16% | 13% | 14,000 |
| 35 | Texas | 15% | 29% | 659,000 |
| 36 | North Dakota | 15% | 11% | 7,000 |
| 37 | Alabama | 14% | 19% | 69,000 |
| 38 | Virginia | 14% | 14% | 90,000 |
| 39 | Georgia | 14% | 23% | 178,000 |
| 40 | Louisiana | 14% | 14% | 48,000 |
| 41 | Wyoming | 12% | 17% | 6,000 |
| 42 | Montana | 12% | 13% | 9,000 |
| 43 | Utah | 12% | 13% | 25,000 |
| 44 | New Mexico | 11% | 16% | 18,000 |
| 45 | Mississippi | 11% | 22% | 37,000 |
| 46 | Alaska | 10% | 17% | 7,000 |
| 47 | Arkansas | 10% | 15% | 22,000 |
| 48 | Idaho | 8% | 18% | 14,000 |
| 49 | Arizona | 7% | 17% | 47,000 |
| 50 | Nebraska | 7% | 12% | 9,000 |
Author
Kathy is the head of content at Zippia with a knack for engaging audiences. Prior to joining Zippia, Kathy worked at Gateway Blend growing audiences across diverse brands. She graduated from Troy University with a degree in Social Science Education.