This is How Much You Need To Earn To Buy a House In Each City (And What’s Unattainable For The Average Worker)

By Kathy Morris
Sep. 8, 2022

Earnings To Buy a House Research Summary

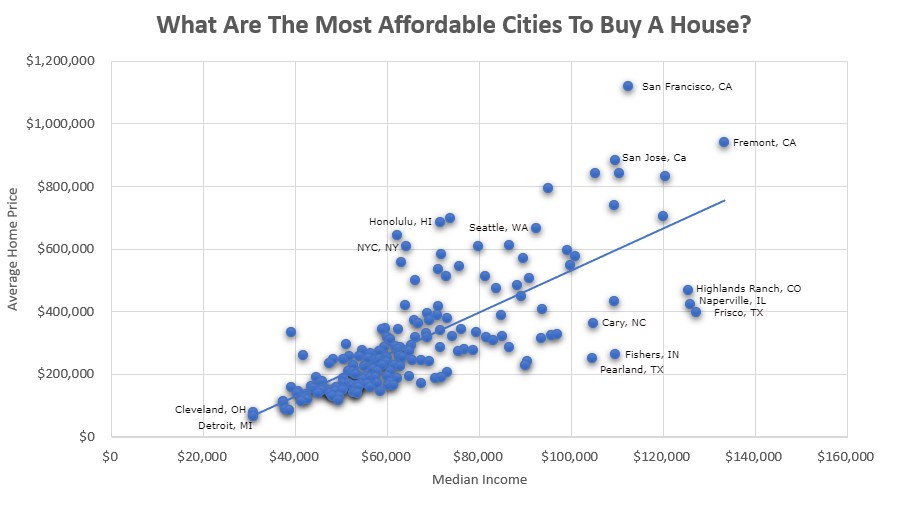
  • The least affordable city in the US is Los Angeles, California, where the average home costs $642,400, but the median income is only $62,142.

  • The most affordable city in the US is Detroit, Michigan, where the average home costs only $66,300!

  • The city with the most expensive homes in the US is San Francisco, California, where the average home costs $1,118,200.

  • Iowa is the most affordable state to buy a home in, with an average home price of $147,800 and a median household income of $79,500.

Buying a house is one of the biggest investments the average worker will ever make. However, the average income needed to buy a house can vary a lot from city to city.

So, we set out to find where the American dream of homeownership is still possible for the average worker- and where it’s quite simply out of reach. First, we found the average home cost. From there we determined how much a monthly mortgage would be for it– and the minimum salary it would take to afford it.

The greater the negative difference between the salary needed to buy a home and the average income, the less attainable home ownership is.

The results? Homeownership is simply out of reach for the average worker in many cities. In fact, of the 175 cities we examined, 51 have a median income below the amount needed for home ownership to be attainable. Concurrently, the US Census shows that only 66% own their own home.

You can see a breakdown of how much it takes to afford a home in each major city (and how we determined this), but first, we break down the most (and least) affordable cities to buy a home.

10 Least Affordable Cities To Buy A Home

  1. Los Angeles, California
  2. San Francisco, California
  3. Honolulu, Hawaii
  4. New York City, New York
  5. Oakland, California
  6. Long Beach, California
  7. Miami, Florida
  8. Huntington Beach, California
  9. Anaheim, California
  10. San Jose, California

Unsurprisingly, buying a house in California can be an expensive undertaking. Californian cities, along with notoriously expensive cities such as Honolulu and NYC, dominate the list. While San Francisco has the most expensive home prices, Los Angeles residents earn on average only $62,142, about half of what the average San Franciscan earns. That is far less than the $130,157 needed to reasonably afford a home.

Where is the grass greener when it comes to home prices? Or at least it takes less of your green to become a homeowner?

10 Most Affordable Cities To Buy A Home

  1. Detroit, Michigan
  2. Akron, Ohio
  3. Toledo, Ohio
  4. Fort Wayne, Indiana
  5. Fishers, Indiana
  6. Pearland, Texas
  7. Cedar Rapids, Iowa
  8. Lee’s Summit, Missouri
  9. Cleveland, Ohio
  10. Grand Prairie, Texas

Midwestern cities remain one of the most affordable places for home ownership. Low home costs and reasonable salaries create an economic situation where home ownership is highly achievable.

HOW WE DETERMINED THIS

This one was fairly simple. We started by finding out the average home value in each major city from the US Census.

We defined major city as the 175 cities with the most owner-occupied housing units with a mortgage.

Home costs will vary within a city. Similarly, some buyers choose more or less expensive houses based on income and personal taste. However, since we are going for a top look at housing and income, the average seemed like a good starting point.

From there, we applied the standard 30-year mortgage with a 3.9% interest rate to work out the monthly payment. We did not take into account PMI, taxes, down payment size, or home insurance, since those differ greatly based on individual circumstances and loan type.

Since it is genuinely recommended for median income not to surpass 28% of gross income, we found the minimum income it would take for the monthly mortgage to be below 28%. That gave us the minimum income needed to buy a home.

Of course, to better understand how reasonable these numbers are, we then took into account median income. Some cities with a high price tag have high incomes that grow in step. However, in others, even lofty salaries don’t pay the bills.

The greater the negative difference between median income and the minimum amount needed to afford the average home, the less affordable home ownership is. Similarly, the greater the positive difference between median income and minimum income needed, the more affordable home ownership is.

Keep scrolling to see the full data.

BREAKING THE BANK TO LIVE THE AMERICAN DREAM

While some cities offer affordable homeownership, in other cities the American dream really is just a dream- and far from reality.

However, ultimately buying a home is a deeply personal choice. The size, location, and style will all vary based on the home buyer. For example, an affordable home in your city might not be in your ideal school district, and one that is might be far beyond your personal budget.

Similarly, a mountain of student debt or other financial obligations might mean you need to spend well below 28% of your income on housing. And as any homeowner knows, the mortgage is far from your biggest expense.

At the end of the day, these numbers are a big-picture look at a situation that can be very different on a personal level.

You can see the full breakdown of our numbers below, from least affordable to most:

The Least To Most Affordable Cities For Homeownership

Rank City Average Home Price Minimum Income Needed Actual Median Income
1 Los Angeles, California $642,400 $130,157 $62,142
2 San Francisco, California $1,118,200 $226,586 $112,449
3 Honolulu, Hawaii $685,000 $138,814 $71,465
4 New York City, New York $609,700 $123,557 $63,998
5 Oakland, California $697,400 $141,300 $73,692
6 Long Beach, California $559,000 $113,271 $63,017
7 Miami, Florida $334,100 $67,714 $39,049
8 Huntington Beach, California $793,300 $160,757 $95,046
9 Anaheim, California $583,700 $118,286 $71,763
10 San Jose, California $882,500 $178,843 $109,593
11 Irvine, California $841,700 $170,571 $105,126
12 San Diego, California $608,100 $123,214 $79,673
13 Carlsbad, California $840,400 $170,314 $110,478
14 Santa Ana, California $501,400 $101,614 $66,145
15 Boston, Massachusetts $534,200 $108,257 $71,115
16 Seattle, Washington $666,200 $135,000 $92,263
17 Santa Rosa, California $545,100 $110,443 $75,630
18 Washington DC $611,400 $123,900 $86,420
19 Fremont, California $940,800 $190,629 $133,354
20 Oceanside, California $511,300 $103,629 $72,697
21 Bellevue, Washington $830,900 $168,386 $120,456
22 Thousand Oaks, California $738,100 $149,571 $109,378
23 Yonkers, New York $420,400 $85,200 $63,849
24 Concord, California $569,400 $115,371 $89,564
25 Chula Vista, California $512,500 $103,843 $81,272
26 New Orleans, Louisiana $260,000 $52,671 $41,604
27 Simi Valley, California $595,200 $120,600 $99,151
28 Portland, Oregon $418,000 $84,686 $71,005
29 Arlington, Virginia $704,800 $142,800 $120,071
30 Fort Lauderdale, Florida $348,000 $70,500 $59,450
31 Reno, Nevada $342,100 $69,300 $58,790
32 Eugene, Oregon $294,200 $59,614 $50,962
33 Denver, Colorado $393,200 $79,671 $68,592
34 Alexandria, Virginia $576,800 $116,871 $100,939
35 Corona, California $474,800 $96,214 $83,752
36 Fort Collins, Colorado $372,800 $75,557 $65,866
37 Rancho Cucamonga, California $506,900 $102,729 $90,953
38 Sacramento, California $343,300 $69,557 $62,335
39 Santa Clarita, California $547,700 $111,000 $99,666
40 Scottsdale, Arizona $483,800 $98,014 $88,213
41 Jersey City, New Jersey $387,900 $78,600 $70,752
42 Lakewood, Colorado $363,200 $73,586 $66,740
43 Riverside, California $372,500 $75,471 $69,045
44 Atlanta, Georgia $317,800 $64,414 $59,948
45 Fontana, California $377,300 $76,457 $72,918
46 Paradise, Nevada $248,200 $50,314 $48,312
47 Salt Lake City, Utah $311,500 $63,129 $60,676
48 Stockton, California $277,900 $56,314 $54,614
49 Roseville, California $448,400 $90,857 $89,082
50 Richmond, Virginia $234,800 $47,571 $47,250
51 Orlando, Florida $256,200 $51,900 $51,757
52 Fresno, California $248,700 $50,400 $50,432
53 Modesto, California $286,800 $58,114 $59,287
54 Charleston, South Carolina $331,100 $67,071 $68,438
55 Tampa, Florida $258,200 $52,329 $53,833
56 Moreno Valley, California $316,500 $64,114 $66,134
57 Austin, Texas $339,600 $68,829 $71,576
58 Spring Valley, Nevada $273,500 $55,414 $58,388
59 Chicago, Illinois $272,700 $55,243 $58,247
60 Vancouver, Washington $287,700 $58,286 $61,714
61 Pembroke Pines, Florida $318,600 $64,543 $68,745
62 Arvada, Colorado $387,000 $78,429 $84,717
63 Las Vegas, Nevada $265,600 $51,986 $56,354
64 Palmdale, California $286,000 $57,943 $62,865
65 Westminster, Colorado $343,800 $69,686 $76,142
66 Aurora, Colorado $293,800 $59,529 $65,100
67 Salem, Oregon $252,300 $51,129 $55,920
68 Tacoma, Washington $278,500 $56,443 $62,358
69 Dallas, Texas $229,000 $46,414 $52,580
70 Elk Grove, California $407,200 $82,500 $93,780
71 Henderson, Nevada $320,200 $64,886 $74,147
72 Baton Rouge, Louisiana $189,800 $38,443 $44,470
73 Boise City, Idaho $255,300 $51,729 $60,035
74 Phoenix, Arizona $244,300 $49,500 $57,459
75 Mesa, Arizona $246,700 $49,971 $58,181
76 Colorado Springs, Colorado $272,800 $55,286 $64,712
77 Thornton, Colorado $334,900 $67,843 $79,411
78 Minneapolis, Minnesota $256,500 $51,986 $62,583
79 Glendale, Arizona $224,800 $45,557 $55,020
80 Shreveport, Louisiana $159,200 $32,271 $39,090
81 Norfolk, Virginia $209,200 $42,386 $51,590
82 Bakersfield, California $253,100 $51,300 $63,139
83 Nashville-Davidson, Tennessee $238,700 $48,386 $59,828
84 Centennial, Colorado $433,600 $87,857 $109,324
85 North Las Vegas, Nevada $236,900 $48,000 $59,835
86 Houston, Texas $205,500 $41,657 $52,338
87 Enterprise, Nevada $317,100 $64,243 $81,461
88 Durham, North Carolina $227,800 $46,157 $58,905
89 Philadelphia, Pennsylvania $176,600 $35,786 $45,927
90 Chattanooga, Tennessee $173,100 $35,057 $45,527
91 Anchorage, Alaska $322,100 $65,271 $84,928
92 Newport News, Virginia $200,400 $40,629 $53,215
93 St. Petersburg, Florida $214,600 $43,500 $56,982
94 Meridian, Idaho $286,100 $54,343 $71,389
95 Madison, Wisconsin $245,300 $49,714 $65,332
96 Albuquerque, New Mexico $198,600 $40,243 $52,911
97 Spokane, Washington $187,500 $38,014 $50,306
98 Highlands Ranch, Colorado $466,900 $94,629 $125,454
99 Tucson, Arizona $161,500 $32,743 $43,425
100 Chandler, Arizona $306,800 $62,186 $82,925
101 Cape Coral, Florida $227,500 $46,114 $61,599
102 Virginia Beach, Virginia $279,000 $56,529 $76,610
103 St. Paul, Minnesota $210,600 $42,686 $57,876
104 Raleigh, North Carolina $244,800 $49,586 $67,266
105 Peoria, Arizona $272,500 $55,200 $75,323
106 Cincinnati, Ohio $145,600 $29,486 $40,640
107 Charlotte, North Carolina $224,100 $45,429 $62,817
108 St. Louis, Missouri $155,200 $31,457 $43,896
109 Chesapeake, Virginia $277,800 $56,271 $78,640
110 Huntsville, Alabama $193,600 $39,214 $55,305
111 Surprise, Arizona $241,300 $48,900 $69,076
112 Knoxville, Tennessee $140,500 $28,457 $40,341
113 Cary, North Carolina $362,100 $73,371 $104,669
114 Port St. Lucie, Florida $209,200 $42,386 $60,587
115 Baltimore, Maryland $172,300 $34,929 $50,379
116 Hampton, Virginia $191,400 $38,786 $56,287
117 Gilbert, Arizona $328,800 $66,643 $96,857
118 Plano, Texas $323,300 $65,529 $95,602
119 McKinney, Texas $315,300 $63,900 $93,354
120 Jacksonville, Florida $183,700 $37,243 $54,701
121 Naperville, Illinois $422,900 $85,714 $125,926
122 Lexington-Fayette, Kentucky $189,400 $38,400 $57,291
123 Little Rock, Arkansas $170,300 $34,500 $51,485
124 Columbus, Georgia $153,400 $31,071 $46,408
125 Overland Park, Kansas $285,400 $57,814 $86,487
126 Winston-Salem, North Carolina $149,000 $30,171 $45,750
127 Sioux Falls, South Dakota $193,200 $39,129 $59,912
128 Greensboro, North Carolina $157,300 $31,886 $48,964
129 Mobile, Alabama $134,900 $27,343 $42,321
130 Frisco, Texas $398,700 $80,786 $127,055
131 Kansas City, Missouri $169,200 $34,286 $54,194
132 San Antonio, Texas $163,100 $33,043 $52,455
133 Fayetteville, North Carolina $139,700 $28,329 $45,024
134 Tulsa, Oklahoma $147,400 $29,871 $47,650
135 Laredo, Texas $147,200 $29,829 $47,593
136 Louisville/Jefferson County, Kentucky $163,600 $33,171 $53,436
137 Milwaukee, Wisconsin $126,900 $25,714 $41,838
138 Fort Worth, Texas $187,100 $37,929 $62,187
139 Buffalo, New York $112,000 $22,714 $37,354
140 Oklahoma City, Oklahoma $166,700 $33,771 $55,557
141 Sterling Heights, Michigan $194,200 $39,343 $64,833
142 Lubbock, Texas $150,700 $30,557 $50,453
143 Indianapolis, Indiana $142,900 $28,971 $47,873
144 Lincoln, Nebraska $171,900 $34,843 $57,746
145 Birmingham, Alabama $110,800 $22,457 $37,375
146 Pittsburgh, Pennsylvania $144,100 $29,186 $48,711
147 El Paso, Texas $140,100 $28,371 $47,568
148 Grand Rapids, Michigan $147,400 $29,871 $50,103
149 Clarksville, Tennessee $156,900 $31,800 $53,604
150 Columbus, Ohio $157,100 $31,843 $53,745
151 Arlington, Texas $174,400 $35,357 $60,571
152 Rochester, Minnesota $207,400 $42,043 $73,106
153 Corpus Christi, Texas $158,700 $32,143 $56,333
154 Augusta-Richmond, Georgia $119,200 $24,171 $42,592
155 Omaha, Nebraska $163,800 $33,171 $60,092
156 Memphis, Tennessee $112,300 $22,757 $41,228
157 Wichita, Kansas $141,900 $28,757 $52,620
158 Amarillo, Texas $141,700 $28,714 $52,725
159 Garland, Texas $164,400 $33,300 $61,211
160 Olathe, Kansas $241,400 $48,900 $90,435
161 Montgomery, Alabama $127,900 $25,929 $48,011
162 Joliet, Illinois $186,800 $37,843 $70,509
163 Aurora, Illinois $189,900 $38,486 $71,749
164 Warren, Michigan $129,100 $26,143 $49,619
165 Des Moines, Iowa $138,300 $28,029 $53,525
166 Grand Prairie, Texas $171,900 $34,843 $67,388
167 Cleveland, Ohio $78,500 $15,900 $30,907
168 Lee’s Summit, Missouri $227,800 $46,157 $89,969
169 Cedar Rapids, Iowa $145,200 $29,443 $58,511
170 Pearland, Texas $252,000 $51,043 $104,504
171 Fishers, Indiana $263,500 $53,400 $109,454
172 Fort Wayne, Indiana $117,900 $23,871 $49,411
173 Toledo, Ohio $87,300 $17,700 $37,752
174 Akron, Ohio $85,700 $17,357 $38,739
175 Detroit, Michigan $66,300 $13,414 $30,894

Now Try Zippia’s Job Search

How useful was this post?

Click on a star to rate it!

Average rating / 5. Vote count:

No votes so far! Be the first to rate this post.

Author

Kathy Morris

Kathy is the head of content at Zippia with a knack for engaging audiences. Prior to joining Zippia, Kathy worked at Gateway Blend growing audiences across diverse brands. She graduated from Troy University with a degree in Social Science Education.

Related posts

Topics: Study