- Industry Statistics
- Wedding Industry Statistics
- Yoga Industry Statistics
- Music Industry Statistics
- Landscaping Industry Statistics
- Bicycle Industry Statistics
- Coffee Industry Statistics
- Car Rental Industry Statistics
- Home Improvement Industry Statistics
- Insurance Industry Statistics
- Supplements Industry Statistics
- Golf Industry Statistics
- Fitness Industry Statistics
- US Media And Entertainment Industry Statistics
- Firearm Industry Statistics
- Financial Services Industry Statistics
- Health And Wellness Industry Statistics
- Trucking Industry Statistics
- Wine Industry Statistics
- Pet Industry Statistics
- Mobile App Industry Statistics
- Digital Marketing Industry Statistics
- Hotel Industry Statistics
- Retail Statistics
- Robotics Industry Statistics
- Jewelry Industry Statistics
- Appointment Scheduling statistics
- Restaurant Industry Statistics
- Food Delivery Statistics
- Food Truck Industry
- Fashion Industry
- Real Estate Industry
- US Film Industry
- US Beverage Industry
- USu202fFast Food Restaurants
- US Construction Industry
- US Book Industry
- Cosmetics Industry
- US Food Retail Industry
- US Pharmaceutical Industry
- US Healthcare Industry
- Airline Industry
- Automobile Industry
- Transportation Industry Statistics
- Event Industry Statistics
- Project Management Statistics
- Oil And Gas Industry Statistics
- Nursing Home Statistics
- Nursing Shortage Statistics
- Nursing Statistics
Research Summary. Food trucks have become a staple of urban dining culture, offering a convenient way for consumers to enjoy diverse culinary experiences on the go. The U.S. food truck industry has continued to thrive and evolve, adapting to changing consumer preferences and market dynamics.
Explore key statistics that highlight the current landscape of the U.S. food truck industry:
-
There are 36,324 food truck businesses operating in the U.S.
-
The estimated market size of the U.S. food truck industry is $1.48 billion.
-
The average cost for necessary permits to launch a food truck is $28,276.
-
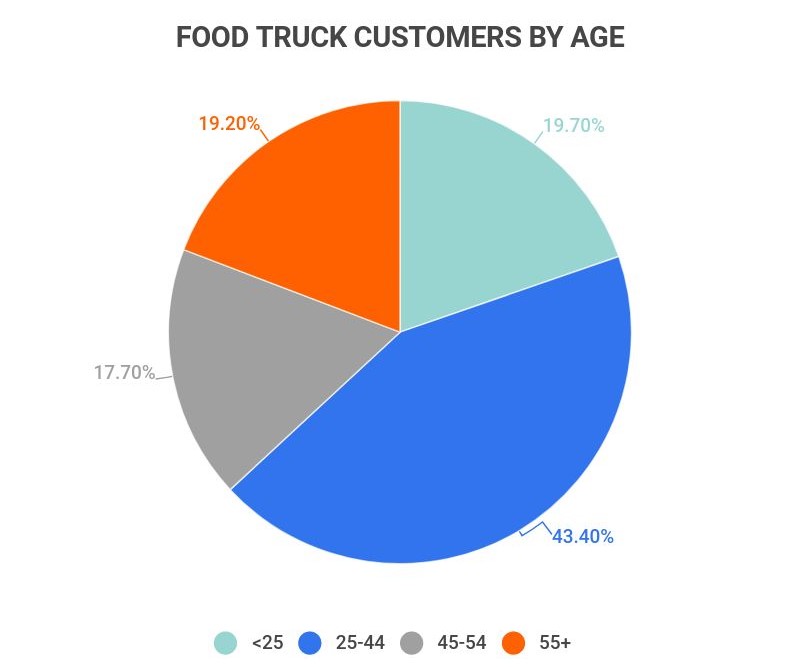
Individuals aged 25 to 44 account for 43% of food truck spending.
-
Since 2018, the U.S. food truck industry has experienced an average annual growth rate of 9.9%.
For a deeper understanding, we have categorized the data into the following sections:
Trends + Projections | Business Owners + Customers | Location + Profitability
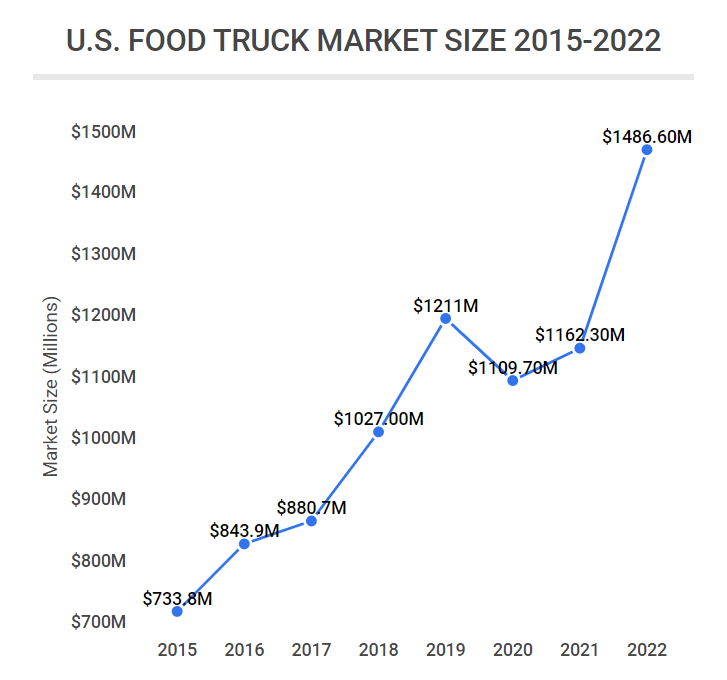
U.S. Food Truck Market Size 2012-2022
| Year | Market Size (in Millions) |
|---|---|
| 2022 | $1,486.6M |
| 2021 | $1,162.3M |
| 2020 | $1,109.7M |
| 2019 | $1,211M |
| 2018 | $1,027M |
| 2017 | $880.7M |
| 2016 | $843.9M |
| 2015 | $733.8M |
| 2014 | $686.6M |
| 2013 | $618.4M |
| 2012 | $534.2M |
General Food Truck Industry Statistics
-
The food truck industry contributed $318 million in annual wages in 2021.
-
The average annual wage in the food truck sector is $38,064.
-
There are approximately 40,547 food truck employees across the U.S.
-
The average food truck business employs about 1.2 individuals.
-
The food truck industry boasts an estimated annual revenue of $2.7 billion.
Food Truck Industry Trends and Predictions
-
In 2011, there were 8,677 food truck businesses in the U.S.
This figure represents just 23.9% of the current total of 36,324 food truck businesses as of 2023.
-
The food truck industry has maintained an average annual growth rate of 9.9% from 2018 to 2023.
The industry has shown steady growth over the past decade, with rapid expansion in the last five years.
-
From 2016 to 2021, the food truck sector experienced an average annual employment growth rate of 8.6%.
Despite a minor decline between 2016 and 2017, the growth rate has consistently increased, reaching 8% in 2021.
-
The market size of the food truck industry has grown by an average of 4.9% annually from 2018 to 2023.
As of 2023, the industry’s market value is $1.49 billion, up from $1.1 billion in 2020, with growth patterns showing resilience despite earlier fluctuations.
-
In 2022, the food truck industry was projected to grow by 3.4%.
This growth would have brought the market value to approximately $1.202 billion, surpassing 2021’s $1.162 billion.
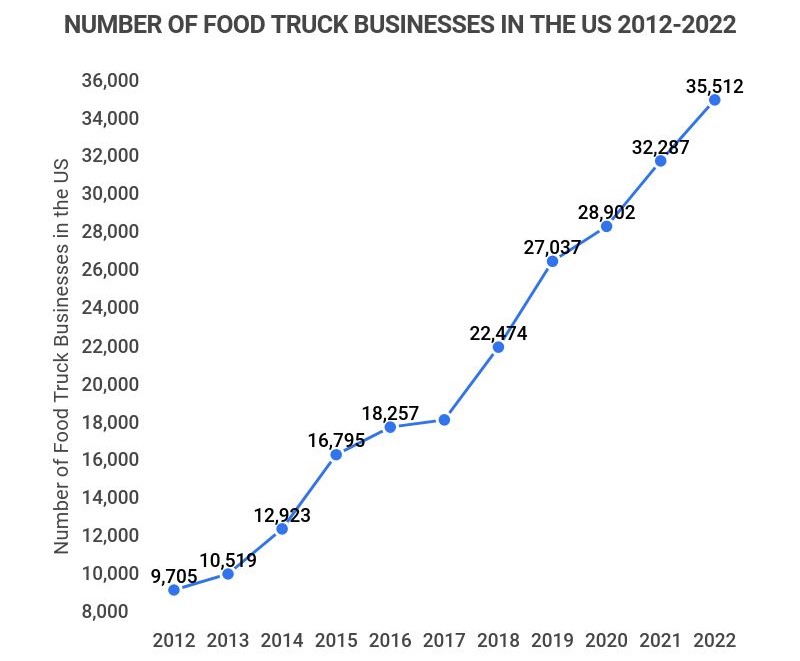
Number of Food Truck Businesses in the U.S. 2012-2023
| Year | Number of U.S. Food Truck Businesses |
|---|---|
| 2023 | 36,324 |
| 2022 | 35,512 |
| 2021 | 32,287 |
| 2020 | 28,902 |
| 2019 | 27,037 |
| 2018 | 22,474 |
| 2017 | 18,675 |
| 2016 | 18,257 |
| 2015 | 16,795 |
| 2014 | 12,923 |
| 2013 | 10,519 |
| 2012 | 9,705 |
Food Truck Business Statistics
-
The U.S. is home to 36,324 food truck businesses.
This marks a 12.5% increase from the total of 32,287 in 2021.
-
Optimal locations for food trucks include business districts, street food markets, and music festivals.
Business districts often lack dining options, making food trucks a convenient choice for hungry workers. Street food markets attract customers specifically looking for food trucks, while music festivals provide a captive audience.
Other profitable locations include parks and retail areas.
-
Food truck owners typically invest an average of $28,276 on permits, licenses, and regulatory compliance in their first year.
This figure excludes costs for the truck, equipment, ingredients, employees, and a prep kitchen, leading to a total startup cost often exceeding $125,000.
-
43% of food truck spending comes from consumers aged 25 to 44.
Additionally, 20% of spending is attributed to those under 25, targeting a demographic that appreciates the unique offerings of food trucks.
Food Truck Location and Profitability Statistics
-
Portland, Oregon, ranks as the top city for food trucks.
It boasts the lowest average cost for necessary permits ($7,287) and minimal compliance restrictions.
The following cities also rank high for food truck success:
-
Denver
-
Orlando
-
Philadelphia
-
Indianapolis
-
Houston
-
Austin
-
Los Angeles
-
New York City
-
Nashville
-
-
Boston, Massachusetts, is considered the most challenging city for food truck operators.
It ranks lowest in terms of ease of obtaining permits and maintaining compliance, posing significant challenges for food truck owners.
Other cities in the bottom five for food truck operation include Washington, D.C., San Francisco, Seattle, and Minneapolis.
-
California leads the U.S. with 753 food truck businesses.
-
Burgers are the most profitable menu item for food trucks.
Due to their consistent popularity and manageable cost, burgers top the list of profitable food truck offerings, followed by:
-
Indian street food
-
Stone-baked pizza
-
Loaded fries
-
Grilled cheese
-
Falafel
-
Macaroni and cheese
-
Food Truck Industry FAQ
-
Is the food truck industry competitive?
Yes, the food truck industry is highly competitive. Food trucks not only compete with each other but also with traditional restaurants and grocery stores, making customer attraction essential for success.
Food trucks excel at events where they cater to a captive audience, allowing owners to leverage unique offerings and strategic locations for a competitive advantage.
-
What is the success rate of food trucks?
Approximately 40% of food trucks remain in business after three years. This figure underscores the competitive nature of the industry, especially when compared to the 55% average success rate for small businesses in the U.S. during the first five years.
-
How much is the food truck industry growing?
The food truck industry is projected to grow by an average of 12.1% annually. This growth trend has been apparent since 2016, with significant increases in the number of food truck businesses from 8,677 in 2011 to 32,287 in 2021.
-
Are food trucks a good investment?
Yes, food trucks can be a profitable investment. With a solid understanding of the food industry and effective business skills, food trucks can yield both financial and personal rewards. However, success requires substantial commitment and resources.
-
Who is the target audience for food truck businesses?
Middle-class millennials are the primary target audience for food trucks. With 43% of monthly food truck expenditures attributed to those aged 25 to 44, along with an additional 20% coming from individuals under 25, food trucks cater to a demographic that values trendiness, convenience, and local business support.
Conclusion
Since its inception in the early 2000s, the food truck industry has rapidly evolved, experiencing an average annual growth rate of 9.9% from 2016 to 2021. From just 8,677 food truck businesses in 2011, the number surged to 32,287 by 2021, with the industry generating an estimated $2.7 billion in annual revenue.
The food truck sector also contributes significantly to employment, with an average annual growth rate of 8.6% from 2016 to 2021, supporting around 38,000 jobs with an average annual wage of $38,064.
Location plays a critical role in the success of food trucks, with varying regulations and permit costs influencing operational ease. Portland, Oregon, stands out as the most favorable city for food trucks, while Boston presents challenges due to stringent regulations.
References
-
Food Truck Nation. “U.S. Chamber of Commerce Foundation Food Truck Index.” Accessed on November 10, 2021.
-
IBISWorld. “Food Trucks in the U.S. – Wage Statistics 2005-2027.” Accessed on November 10, 2021.
-
IBISWorld. “Food Trucks in the U.S. – Employment Statistics 2005-2027.” Accessed on November 10, 2021.
-
IBISWorld. “Food Trucks in the U.S. – Number of Businesses 2005-2027.” Accessed on November 10, 2021.
-
IBISWorld. “Food Trucks in the U.S. – Market Size 2005-2027.” Accessed on November 10, 2021.
-
Street Food Central. “Where are Food Trucks Most Successful?” Accessed on November 10, 2021.
-
Webstaurant Store. “Food Truck Marketing.” Accessed on November 10, 2021.
-
Street Food Central. “7 Most Profitable Food Truck Items.” Accessed on November 10, 2021.
-
IBIS World. “Food Trucks in the US – Market Size 2005–2029.” Accessed on March 5, 2023.
-
IBIS World. “Food Trucks in the US – Number of Businesses 2005–2029.” Accessed on March 5, 2023.
- Industry Statistics
- Wedding Industry Statistics
- Yoga Industry Statistics
- Music Industry Statistics
- Landscaping Industry Statistics
- Bicycle Industry Statistics
- Coffee Industry Statistics
- Car Rental Industry Statistics
- Home Improvement Industry Statistics
- Insurance Industry Statistics
- Supplements Industry Statistics
- Golf Industry Statistics
- Fitness Industry Statistics
- US Media And Entertainment Industry Statistics
- Firearm Industry Statistics
- Financial Services Industry Statistics
- Health And Wellness Industry Statistics
- Trucking Industry Statistics
- Wine Industry Statistics
- Pet Industry Statistics
- Mobile App Industry Statistics
- Digital Marketing Industry Statistics
- Hotel Industry Statistics
- Retail Statistics
- Robotics Industry Statistics
- Jewelry Industry Statistics
- Appointment Scheduling statistics
- Restaurant Industry Statistics
- Food Delivery Statistics
- Food Truck Industry
- Fashion Industry
- Real Estate Industry
- US Film Industry
- US Beverage Industry
- USu202fFast Food Restaurants
- US Construction Industry
- US Book Industry
- Cosmetics Industry
- US Food Retail Industry
- US Pharmaceutical Industry
- US Healthcare Industry
- Airline Industry
- Automobile Industry
- Transportation Industry Statistics
- Event Industry Statistics
- Project Management Statistics
- Oil And Gas Industry Statistics
- Nursing Home Statistics
- Nursing Shortage Statistics
- Nursing Statistics
Author
Abby is a writer who is passionate about the power of story. Whether it’s communicating complicated topics in a clear way or helping readers connect with another person or place from the comfort of their couch. Abby attended Oral Roberts University in Tulsa, Oklahoma, where she earned a degree in writing with concentrations in journalism and business.