Research Summary. Analyzing historic unemployment statistics illustrates the cyclical nature of the U.S. labor market, characterized by periods of economic expansion and contraction. The most significant recent downturn occurred during the COVID-19 pandemic, which reshaped the workforce landscape and prompted lasting changes in employment patterns.
After thorough analysis, our data insights reveal:
-
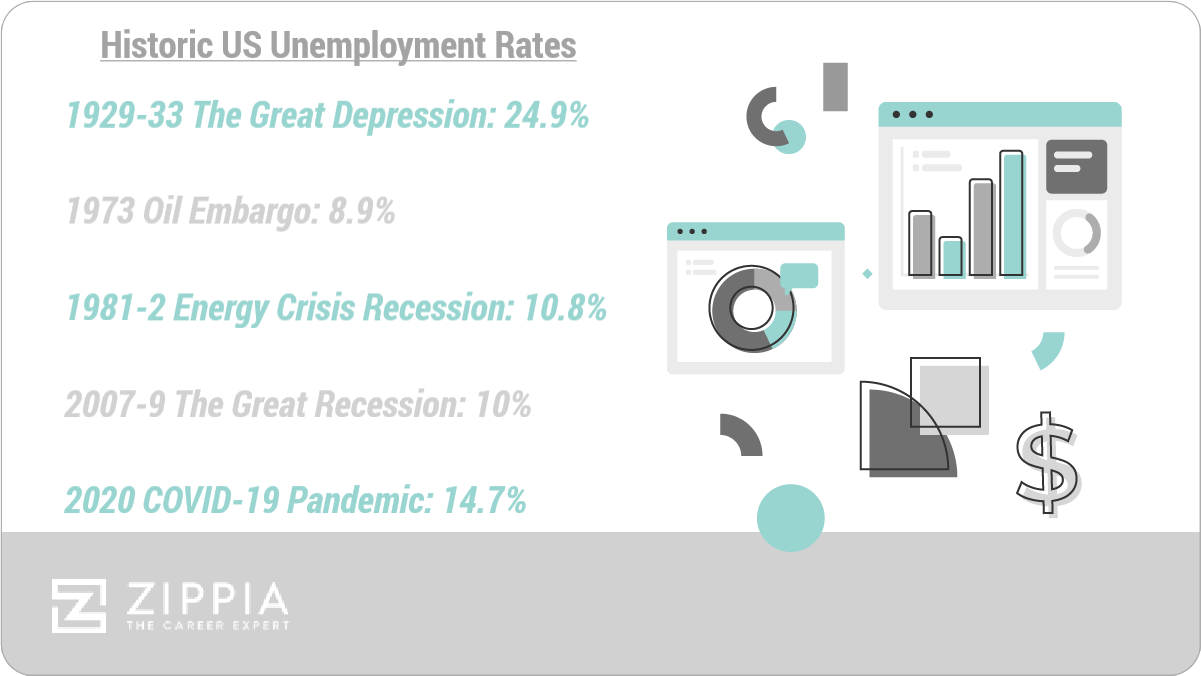
The highest unemployment rate in U.S. history occurred during the Great Depression (1929-1933), with a staggering 24.9%.
-
Unemployment reached nearly 9% during the Oil Embargo recession that began in fall 1973, marking the highest level since the Great Depression.
-
During the Energy Crisis recession (1981-1982), unemployment peaked at 10.8%.
-
The Great Recession (2007-2009) saw unemployment surpass 10%, a level that endured longer than in previous recessions since the 1940s.
-
The COVID-19 pandemic precipitated the most recent recession, with unemployment soaring to 14.7%.
For further insights, we categorized the data in the following sections:
Great Depression | Oil Embargo | Energy Crisis | 1990s Dot-Com Boom | Great Recession | Late 2019/Early 2020 | COVID-19 Pandemic
Great Depression Unemployment Statistics
-
The Great Depression commenced in August 1929.
It wasn’t until October 24, 1929, when the stock market crashed (known as “Black Thursday”), causing a 22% drop in stock prices over four days. The Great Depression persisted until 1933.
Although it began in the U.S., the Great Depression’s effects—such as declines in output, soaring unemployment, and severe deflation—were felt globally due to the gold standard. Industrial production plummeted by 47%, GDP fell by 30%, deflation reached 33%, and unemployment soared to 24.9%.
To date, it remains the most extensive and severe depression in recorded history.
-
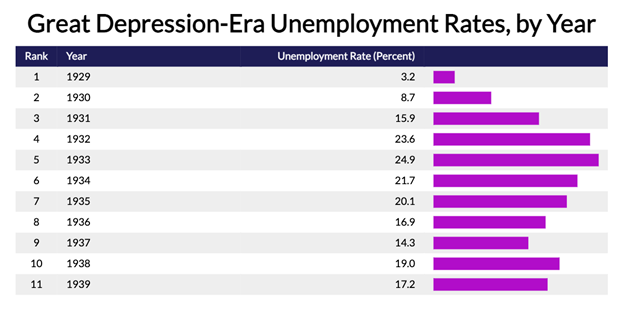
Unemployment peaked at 24.9% in 1933 and did not dip below 14% until 1941.
In 1929, the U.S. economy was at full employment, yet just four years later, unemployment soared to its peak. Below is a timeline of unemployment rates during and after the Great Depression:
-
1929: 3.2%
-
1930: 8.7%
-
1931: 15.9%
-
1932: 23.6%
-
1933: 24.9%
-
1934: 21.7%
-
1935: 20.1%
-
1936: 16.9%
-
1937: 14.3%
-
1938: 19%
-
1939: 17.2%
-
-
Unemployment during the Great Depression often exceeded one year.
Many job seekers remained unemployed for extended periods, while those who retained jobs frequently faced involuntary part-time employment.
-
The banking sector suffered immensely during the Great Depression.
Following four waves of banking panic between 1930 and 1932, one-fifth of banks failed, resulting in significant job losses. Approximately 11,000 banks shut down between 1929 and 1933.
-
Higher-skilled workers experienced lower unemployment rates compared to lower-skilled workers.
Consequently, sectors such as agriculture, construction, and manufacturing faced higher unemployment rates and longer durations of unemployment compared to skilled professions.
-
The Social Security Act established unemployment insurance in 1935.
In response to the Great Depression and prolonged unemployment, President Franklin D. Roosevelt signed the Social Security Act into law on August 14, 1935.
This Act not only created a safety net for those aged 62 and older but also established unemployment insurance, old-age assistance, and aid to dependent children.
The U.S. unemployment insurance program is funded through state and federal taxes levied on employers, which are then placed into an Unemployment Trust Fund for distribution to those in need.
Oil Embargo Recession Unemployment Statistics
-
In February 1966, the U.S. unemployment rate dipped below 4% as annual growth exceeded 6%.
However, by fall 1973, unemployment surged to nearly 9%, and GDP contracted by 3.4% due to the OPEC oil embargo, price and wage freezes, and a global stock market crash, resulting in quadrupled oil prices and reduced consumer spending.
Energy Crisis Recession
-
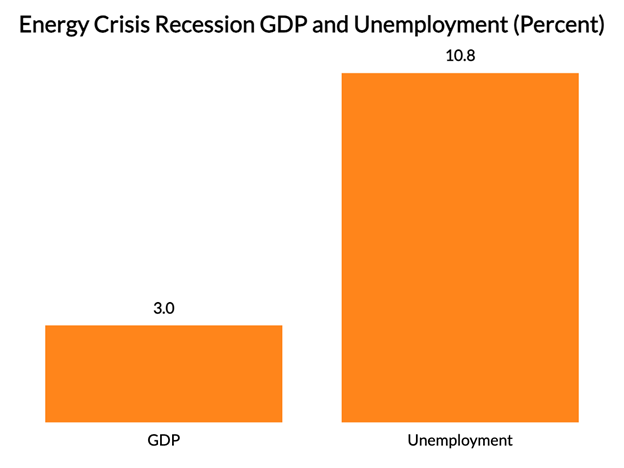
Following a recession just a year prior, the energy crisis recession lasted from July 1981 to November 1982.
This recession stemmed from stringent monetary policies that elevated interest rates. While these actions curbed inflation, GDP fell by 3%, and unemployment soared to 10.8%.
1990s Dot-Com Boom Unemployment Statistics
-
From the mid-1990s to 2001, the Internet sector and related high-tech industries expanded rapidly.
Fueled by venture capital investments, high-paying job opportunities flourished in Silicon Valley, driving unemployment down to 4%.
Additionally, by spring 1999, one in 12 Americans surveyed indicated they were in the process of starting a business.
-
Speculative investments and inflated valuations in the dot-com sector led to significant stock market volatility.
In January 2000, the Dow Jones Industrial Average peaked at 11,722.98, and the NASDAQ reached 5,048.62 in March. However, the bubble burst rapidly, with the NASDAQ losing 34.2% of its value from March to April 2000. By October 2002, it had plummeted 73% and did not reach similar levels until March 2015.
The S&P 500 also experienced a 43% decline in value between 2000 and 2002.
-
Following the dot-com bubble burst, unemployment peaked at 5.5%.
The brief recession that ensued saw GDP drop by only 0.6%, but unemployment rose to 5.5%. In Santa Clarita, CA, the heart of Silicon Valley, unemployment reached 7% by the end of 2001.
-
A decline in high-tech employment followed the dot-com boom, yet wages increased.
Silicon Valley saw a reduction of approximately 17% in high-tech jobs, equivalent to around 85,000 positions, while average wages grew by nearly 36%.

Great Recession Unemployment Statistics
-
Between 1948 and 2011, the U.S. experienced ten recessions.
The Great Recession, which lasted from December 2007 to June 2009, resulted in a GDP decline of 4.3% and an unemployment peak of 10.6% in January 2010, with unemployment rising by 8.8 million individuals.
This period also witnessed prolonged unemployment levels that persisted longer than previous recessions since the late 1940s.
-
Men’s unemployment rates during the Great Recession were generally higher than women’s.
Since the early 1980s, unemployment among men consistently outpaced that of women, a trend that continued during the Great Recession, with men’s unemployment rates exceeding women’s by over a percentage point.
-
Black workers faced the highest peak unemployment rates among racial groups during the Great Recession, with a significant gap between Black men and women.
Here are the peak unemployment numbers by gender and race during the Great Recession:
Gender Race Great Recession Peak Unemployment Women White 7.6% Black 15.3% Asian 8.6% Hispanic 13.4% Men White 10.6% Black 21.2% Asian 9.7% Hispanic 15% -
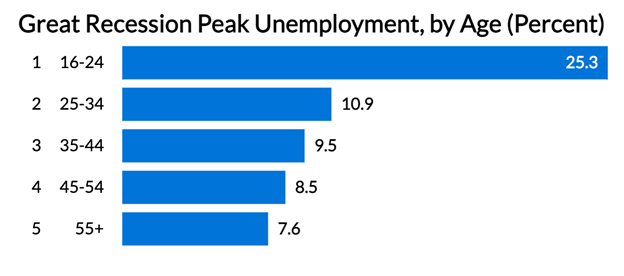
Younger demographics experienced the highest peak unemployment rates during the Great Recession.
Here are the peak unemployment rates by age:
-
16-24: 25.3%
-
25-34: 10.9%
-
35-44: 9.5%
-
45-54: 8.5%
-
55+: 7.6%
-
-
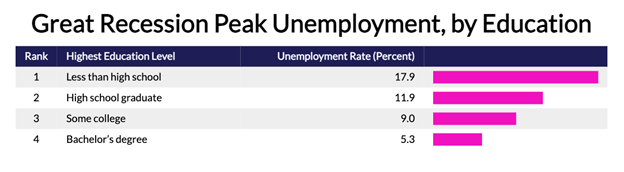
Individuals with lower educational attainment faced higher unemployment rates during the Great Recession compared to those with higher education levels.
Here are the peak unemployment figures by education level:
-
Less than high school education: 17.9%
-
High school graduate: 11.9%
-
Some college: 9%
-
Bachelor’s degree: 5.3%
-
-
Unemployment rates varied significantly across states during the Great Recession.
States such as North Dakota, Nebraska, and South Dakota maintained unemployment rates at or below 5.2%, while states like Nevada, California, and Michigan experienced much higher rates of around 10%.
-
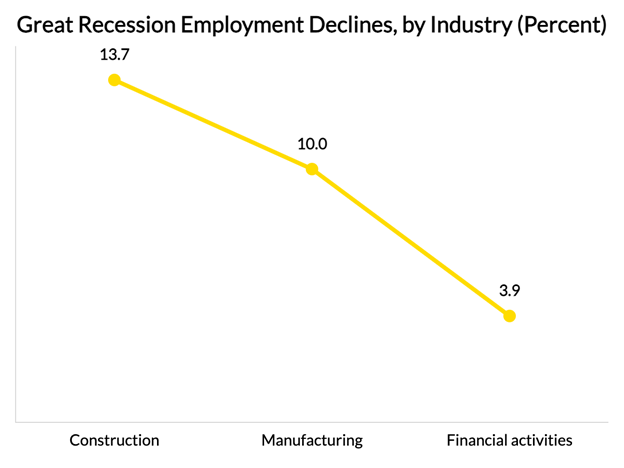
The construction and manufacturing sectors faced the highest unemployment levels during the Great Recession.
As is typical in recessions, goods-producing industries saw substantial employment declines. The Great Recession was no exception, with construction employment dropping by 13.7% and manufacturing by 10%.
Meanwhile, the financial activities sector’s employment decreased by 3.9%, while education and health services actually experienced growth. Notably, employment in these sectors has only declined in one of the twelve recessions since 1945.
-
Business closures outnumbered openings during the Great Recession.
Between 2007 and 2009, 235,000 establishments closed, while only 172,000 opened—the lowest net openings recorded since 1992—leaving many workers without jobs.
Overall, job openings plummeted by 44% to 2.1 million, and total employment declined by 5%.
-
Mass layoffs became commonplace during the Great Recession.
A mass layoff is defined as at least 50 initial claims for unemployment insurance filed against an establishment within a consecutive five-week period. In February 2009 alone, employers initiated 3,059 mass layoffs, resulting in over 326,000 workers losing their jobs.
-
Between December 2007 and early 2010, the U.S. economy shed 8.7 million jobs.
The Recovery Act, enacted by President Obama and Congress in February 2009, slowed the rate of job losses. However, job creation did not resume until 2010, and it took until 2014 for the economy to recover the lost jobs, with the unemployment rate not returning to 5% until late 2015.
Late 2019/Early 2020 Unemployment Statistics
-
By 2019, the U.S. recorded historically low unemployment rates, with a jobless rate of 3.5% for both men and women—the lowest in 50 years.
The economy had also seen 126 months of growth, marking the longest economic expansion on record before the onset of the COVID-19 pandemic.
-
The unemployment rate in 2019 hit a 50-year low.
During the fourth quarter of 2019, 5.8 million people were unemployed—a decrease of 341,000 from the previous year. The national unemployment rate fell to 3.5%, the lowest since 1969.
-
Nevertheless, labor force participation rates remained at their lowest level since 1977.
Despite historically low unemployment, the labor force participation rate was 62.9%, attributed to many individuals ceasing to actively seek work and thus not counted as unemployed.
COVID-19 Pandemic Unemployment Statistics
-
By April 2020, as businesses braced for the impact of the COVID-19 economic downturn, the unemployment rate skyrocketed to 14.7%.
This represented the largest one-month increase in history, leaving 20.5 million Americans jobless.
-
Unemployment claims surged, exceeding six million per week in early April 2020.
From April to June 2020, over 36.5 million individuals filed initial unemployment claims.
-
The retail and food service sectors were among the hardest hit during the COVID-19 pandemic.
At the pandemic’s onset, retail and foodservice sales decreased by over 16%, leaving many workers in these industries without stable employment.
-
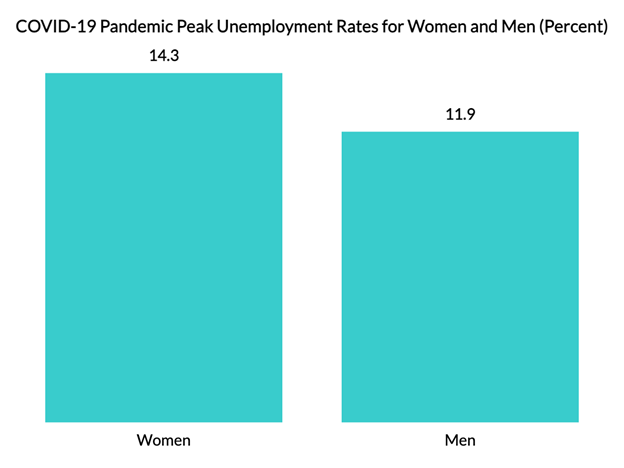
In May 2020, the unemployment rate for women was 14.3%, significantly higher than men’s at 11.9%.
This contrasts sharply with the Great Recession, when women’s unemployment peaked at 9.4% in July 2010, compared to 12.3% for men in January 2010.
-
Similar to the Great Recession, Black women and men experienced disproportionately high unemployment rates during the COVID-19 pandemic.
Here are the unemployment comparisons between February 2020 and the peak in May 2020:
Gender Race February 2020 COVID-19 Pandemic Peak Unemployment (May 2020) Women White 2.5% 11.9% Black 5.2% 17.2% Asian 2.8% 16.7% Hispanic 5.5% 19.5% Men White 3.5% 9.7% Black 7.3% 15.8% Asian 2.2% 13.3% Hispanic 4.3% 15.5% -
Immigrants faced higher unemployment rates than U.S.-born workers during the COVID-19 pandemic.
In February 2020, U.S.-born workers had a 3.6% unemployment rate compared to 3.8% for immigrants. In May, these figures rose to 12.4% and 15.7%, respectively.
-
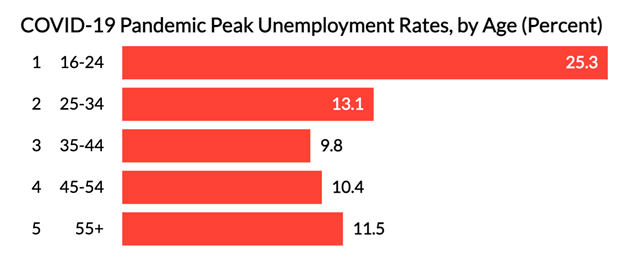
Younger workers aged 16 to 24 encountered significantly higher unemployment levels in May 2020 compared to older age groups.
Here’s the breakdown by age:
-
16-24: 25.3%
-
25-34: 13.1%
-
35-44: 9.8%
-
45-54: 10.4%
-
55+: 11.5%
-
-
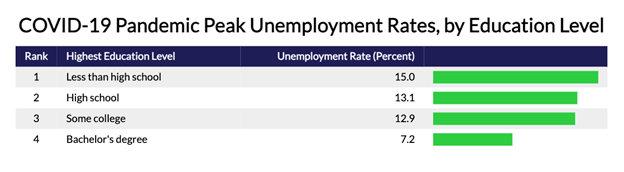
Less educated individuals were more likely to be unemployed in May 2020.
Here are the unemployment rates in May 2020 by education level:
-
Less than high school education: 18.5%
-
High school graduate: 15%
-
Some college: 12.9%
-
Bachelor’s degree: 7.2%
-
Unemployment FAQ
-
How does the U.S. define unemployment?
The U.S. Bureau of Labor Statistics officially defines unemployment as “people who are jobless, actively seeking work, and available to take a job.”
-
How does the U.S. determine unemployment rates?
The U.S. determines unemployment rates as a percentage of the labor force by adding the number of employed and unemployed.
-
When has the U.S. experienced record periods of unemployment?
The U.S. experienced record periods of unemployment during the Great Depression (1929-1933), the Oil Embargo recession (1983-1975), the Energy Crisis recession (1981-1982), the Great Recession (2007-2009), and the COVID-19 pandemic (2020-2021).
-
What is the lowest unemployment rate in U.S. history?
The lowest unemployment rate in U.S. history was 2.5%. This occurred in May and June of 1953 and was attributed to the post-war boom after WWII. It also marked a significant recovery from the 1930s, which saw unemployment rates as high as 24.9%.
Additionally, the lowest unemployment rate in the 21st century was 3.5%, recorded in 2019, marking the lowest unemployment rates in over 50 years prior to the COVID-19 pandemic.
-
What is the highest unemployment rate in U.S. history?
The highest unemployment rate in U.S. history was 24.9%. This occurred in the Great Depression (1933) and has been increasing for several years. The second-highest unemployment rate occurred in 1932, peaking at 23.6%.
The COVID-19 pandemic also caused a historic spike in unemployment, reaching 14.7% in 2020, the highest level since the Great Depression.
-
Hidden unemployment refers to additional unemployment or underemployment that is not officially recorded. With over 150 million workers in the U.S., gathering accurate data can be challenging.
Only individuals who are out of work but actively seeking employment are classified as unemployed. Consequently, those who have ceased their search, are underemployed, or are working in jobs unrelated to their qualifications are not included in official unemployment statistics.
The number of workers who fall into these categories contributes to what is considered hidden unemployment.
Conclusion
Economic cycles, including fluctuations in unemployment rates, are a consistent feature of the U.S. labor market. The nation has faced various peaks and troughs since the Great Depression, and only time will determine the duration and impact of the current economic landscape.
Sources
-
Encyclopædia Britannica. Great Depression. Accessed on 9/13/21.
-
Forbes. 3 Reasons Unemployment Is Already At Great Depression Levels. Accessed on 9/13/21.
-
San José State University. The Depression of the 1930’s and Its Origins or Causes. Accessed on 9/13/21.
-
U.S. Bureau of Labor Statistics. Monthly Labor Review – April 2020. Accessed on 9/13/21.
-
Pew Research Center. Unemployment rose higher in three months of COVID-19 than it did in two years of the Great Recession. Accessed on 9/13/21.
-
U.S. Bureau of Labor and Statistics. BLS Spotlight on Statistics: The Recession of 2007–2009. Accessed on 9/13/21.
-
Center on Budget and Policy Priorities. Chart Book: The Legacy of the Great Recession. Accessed on 9/13/21.
-
The Balance. Unemployment Rate by Year Since 1929 Compared to Inflation and GDP. Accessed on 9/14/21.
-
CNBC. Unemployment is nearing Great Depression levels. Here’s how the eras are similar — and different. Accessed on 9/14/21.
-
EveryCRSReport.com. The Labor Market During the Great Depression and the Current Recession. Accessed on 9/14/21.
-
Cornell Law School, Legal Information Institute. Unemployment Compensation law: an overview. Accessed on 9/14/21.
-
U.S. Social Security Administration. Historical Background And Development Of Social Security. Accessed on 9/14/21.
-
The Gilder Lehrman Institute of American History. Statistics: The Impact of the Depression. Accessed on 9/14/21.
-
The New York Times. Unemployment Is Low, but That’s Only Part of the Story. Accessed on 9/14/21.
-
U.S. Bureau of Labor Statistics. After the Dot-Com Bubble: Silicon Valley High-Tech Employment and Wages in 2001 and 2008. Accessed on 9/14/21.
-
The Economist. How does today’s tech boom compare with the dotcom era? Accessed on 9/14/21.
-
Ideas.TED.com. A revealing look at the dot-com bubble of 2000 — and how it shapes our lives today. Accessed on 9/14/21.
-
U.S. Bureau of Labor Statistics. Graphics for Economic News Releases: Civilian unemployment rate. Accessed on 9/14/21.
-
Marketplace. U.S. unemployment rate falls to 49-year low of 3.7 percent. Accessed on 9/14/21.
-
CNBC. How many recessions you’ve actually lived through and what happened in every one. Accessed on 9/14/21.
Author
Chris Kolmar is a co-founder of Zippia and the editor-in-chief of the Zippia career advice blog. He has hired over 50 people in his career, been hired five times, and wants to help you land your next job. His research has been featured on the New York Times, Thrillist, VOX, The Atlantic, and a host of local news. More recently, he's been quoted on USA Today, BusinessInsider, and CNBC.