Research Summary. In the wake of the economic fluctuations in recent years, inflation has become a hot topic of discussion among Americans. As we navigate through the complexities of the global market and its impacts, many continue to feel the pressure on their finances.
How severe are the current inflation rates? To provide clarity, we’ve compiled pertinent data about inflation trends leading into 2026, which reveals that:
-
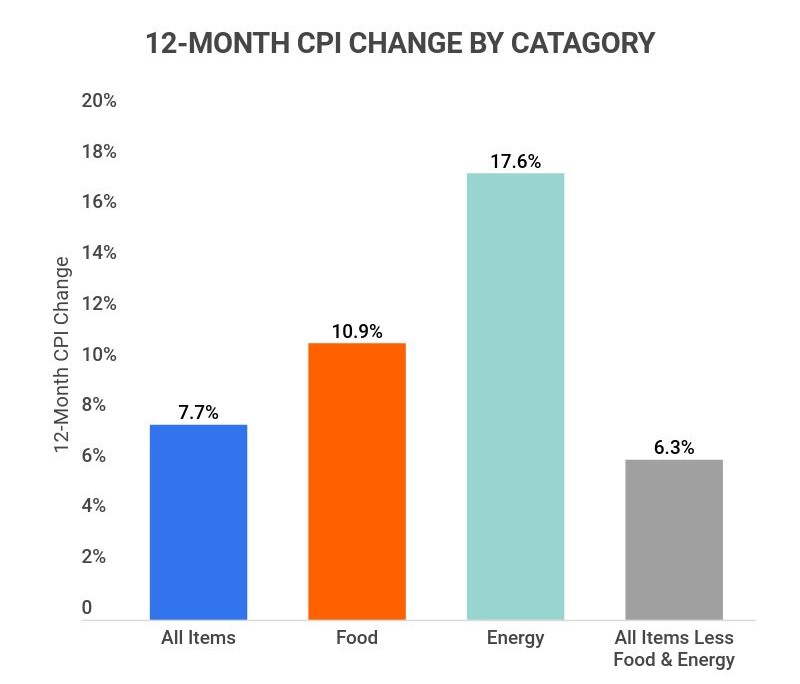
The overall consumer price index (CPI) has increased by 7.7% over the past 12 months (October 2022- October 2023).
-
As of October 2023, the CORE inflation rate in the United States has risen by 6.28% in a 12-month period.
For further analysis, we broke down the data in the following ways:
Trends and Projections | Producer Price Index | Global
U.S. Inflation Statistics by CPI and Selected Categories
While overall inflation has increased, certain sectors have experienced significantly higher inflation rates. To illustrate the impact across various industries, here are the key statistics:
-
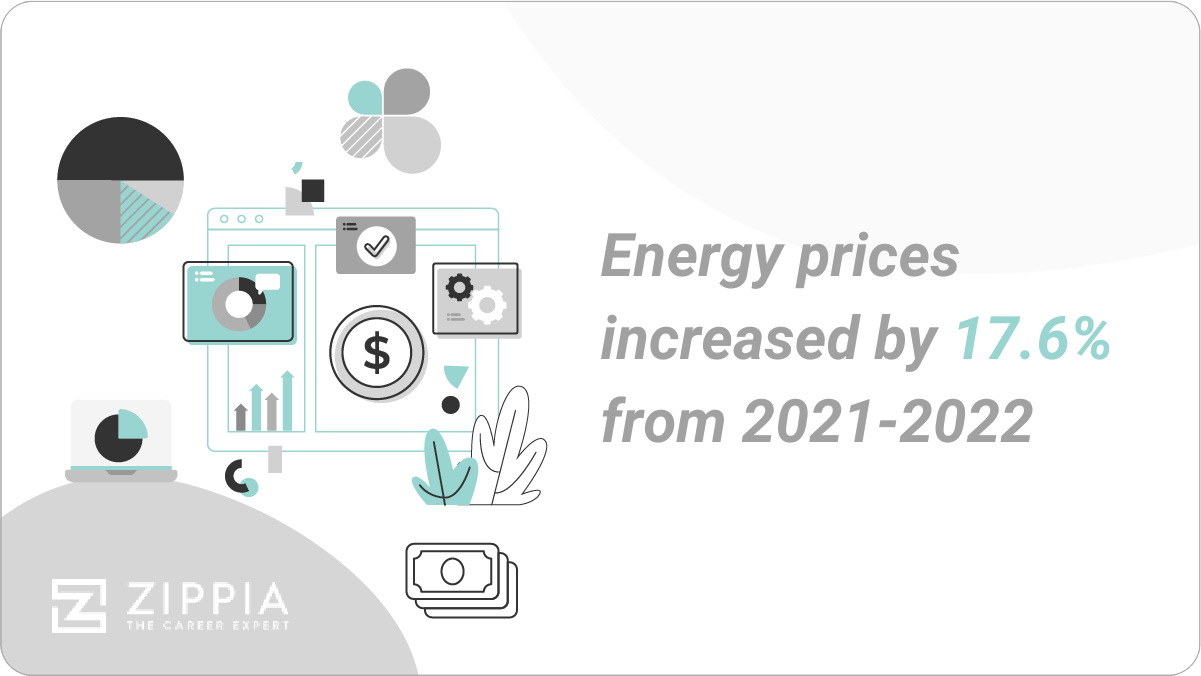
The Energy category has witnessed the highest 12-month CPI increase, at 17.6%.
Prices in this sector have been affected by global events, including geopolitical tensions and supply chain challenges, leading to persistent high prices for natural gas and oil.
-
The Food category has seen a concerning 12-month CPI of 10.9%.
Food prices have been rising steadily, particularly for food-at-home items, which have had a 12-month CPI of 8.6%. Conversely, food away from home has experienced a 12-month CPI of 6.4%.
-
The food product with the most significant price increase is Eggs, now 25.6% more expensive than in 2021.
In February 2021, the average price of eggs was $1.60, rising to $2.01 a year later. Other notable price hikes include Beef (8.9%), Milk (15.1%), Oranges (9.8%), Chicken (3.2%), and Bread (2.6%).

-
From February 2022 to October 2023, the 12-month CPI of used cars fell from 41.2% to just 2%.
Despite the recent decrease, the cost of used cars remains high compared to 2021. For example, a used car valued at $15,000 in February 2021 would have been valued at $21,150 in February 2022. Additionally, new car prices have risen by 12.4% over the past year.
-
The price of all items excluding food and energy has increased by 6.3% over the past 12 months.
This includes categories such as Apparel (4.1%), New Vehicles (8.4%), Used Cars and Trucks (2.0%), Shelter (6.9%), Medical Care services (5.4%), and Transportation services (15.2%).
-
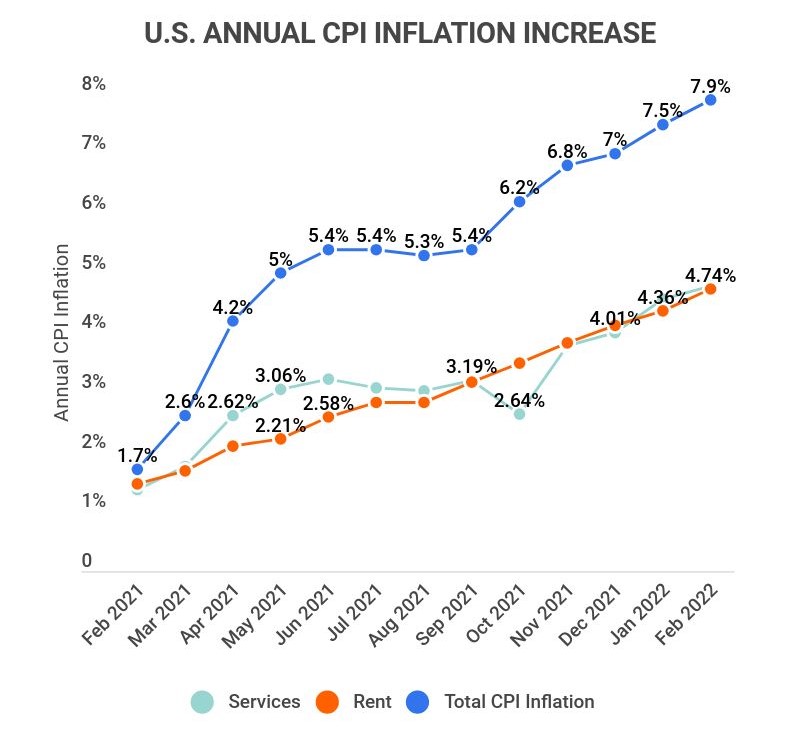
From February 2021 to February 2022, the inflation rate surged from 1.7% to 7.9%.
This dramatic increase marks a historic shift, with the inflation rate rising more than threefold within just one year, significantly impacting everyday consumer products and services.
-
The 12-month Rent inflation rate has grown from 1.46% to 4.74%.
While this increase is less pronounced than the overall inflation rate, the rise in rent prices is a significant concern for renters nationwide.
-
The 12-month Services inflation rate has climbed from 1.36% to 4.79%.
This category comprises a substantial portion of the consumer price index, accounting for 57%, making it a vital metric for assessing overall inflation trends.
-
From February 2021 to February 2022, the CORE U.S. inflation rate rose from 1.3% to 6.4%.
Starting in September 2021, inflation rates saw consistent monthly increases of 0.03-0.06%, leading to a rapid rise from 4% to 6.4% in less than half a year.
-
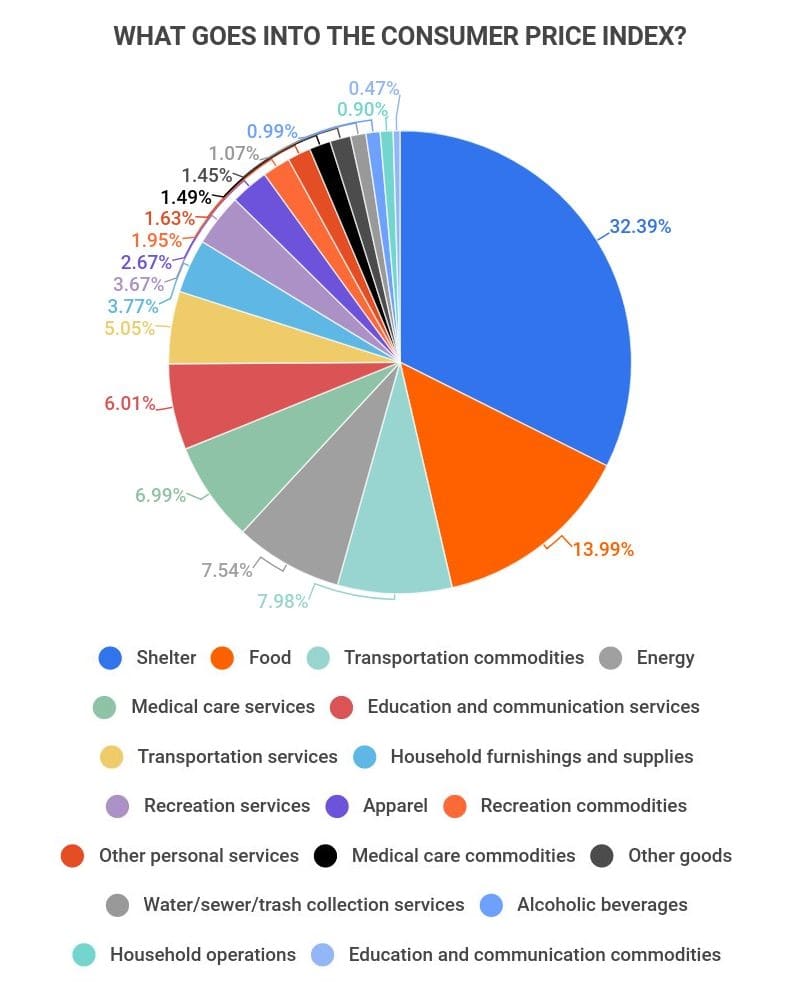
Shelter is the most significant component contributing to the CPI, accounting for 32.39%.
Other major components include Food (13.99%), Transportation commodities (7.98%), Energy (7.54%), and Medical care services (6.99%).
U.S. Inflation Trends and Projections
As inflation continues to impact daily life, many are left wondering whether these rates will persist or stabilize. Our research indicates:
-
The current inflation rate is the highest it has been since 1980, when it peaked at 14.4%.
Although today’s rates are significantly lower than that historical peak, they remain at levels not seen since 1982, marking a crucial time for economic observers.
-
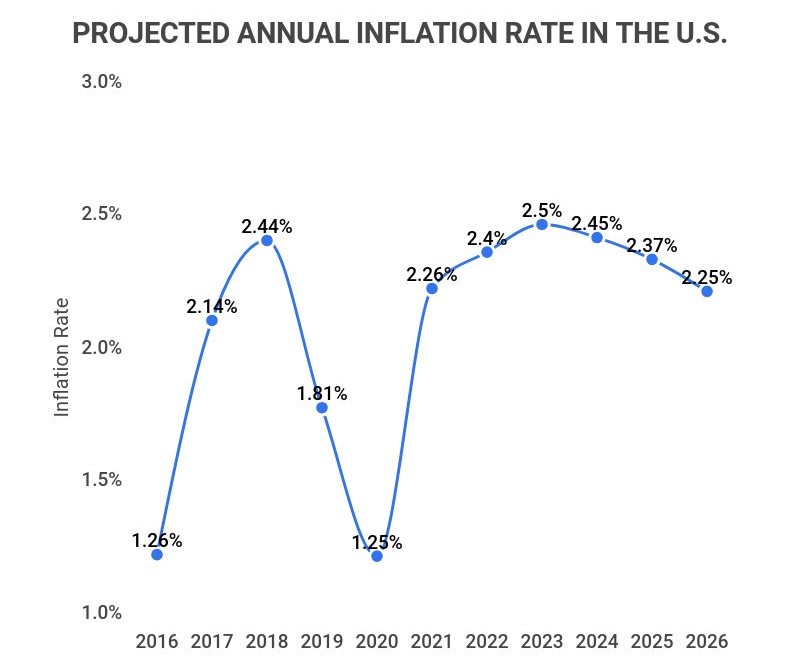
Since 2016, the average annual inflation rate has fluctuated between 1.25% and 2.45% each year.
The year 2018 recorded the highest year-over-year increase at 2.44%, while 2020 saw the lowest increase of 1.25%.
-
Year-over-year inflation increases through 2026 are projected to remain between 2.25% and 2.5%.
This suggests that prices may be approximately 9.5% higher than they are today, indicating a continued upward trend in inflation.
U.S. Inflation Statistics by PPI (Producer Price Index)
The Producer Price Index (PPI) significantly influences the cost of goods and services. Here are some insights into the current state of the U.S. PPI:
-
The 12-month increase in total PPI between 2022-2023 was 10%.
Total PPI reached a peak in January 2022 with a 1.2% month-over-month change. After experiencing a dip in April 2020, the total PPI for final demand has been steadily rising month-over-month, recorded at 0.8% as of February 2022.

-
Over a 12-month period, the PPI for the Energy category surged by 33.8%.
Each major category has seen significant PPI increases: Transportation and warehousing (16.6%), Goods (14.4%), Trade (14.4%), Foods (13.7%), and Services (7.8%).
-
As of February 2022, Energy had the highest one-month PPI at 8.2%.
Other categories with notable PPI increases include Goods (2.4%), Foods (1.9%), and Transportation and warehousing (1.9%). Services remained the only category without any PPI increase that month.
Global Inflation Statistics
While the U.S. grapples with inflation, other countries are similarly affected. Global events have significant ramifications for economies worldwide. Here are notable insights into global inflation rates:
-
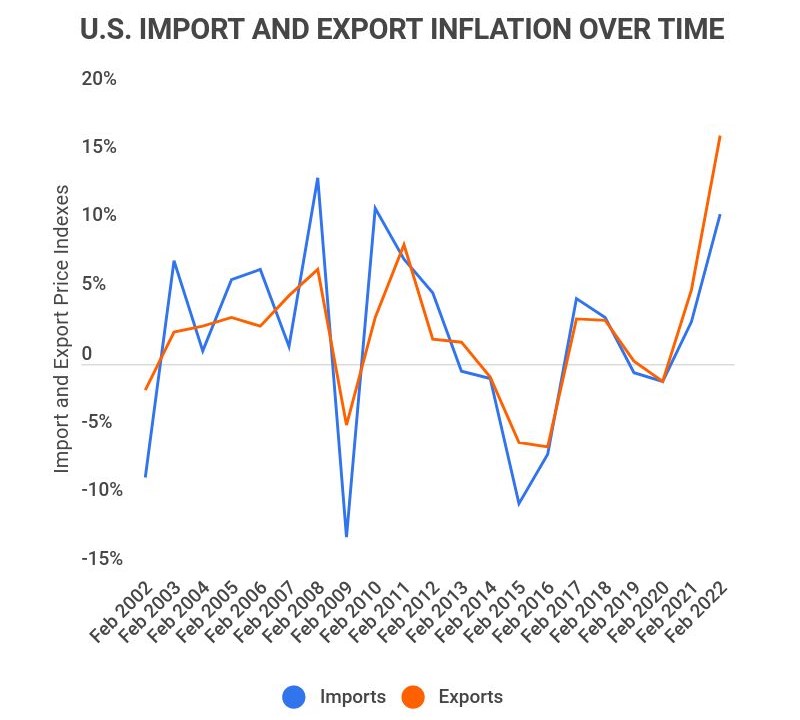
The price of all U.S. Exports has increased by 16.6% over a 12-month period.
-
Correspondingly, the price of all U.S. Imports has risen by 10.9% in the same timeframe.
-
Zimbabwe currently holds the highest average annual CPI inflation rate at 577.2%.
-
Comoros has the lowest average annual CPI inflation rate at -4.3%.
-
The United States has an average annual CPI inflation rate of 1.23%, slightly below the global average of 1.89%.
-
Turkey leads among OECD countries with an annual inflation growth rate of 61.1%.
-
Conversely, Japan has the lowest annual inflation growth rate among OECD countries, at 0.9%.
| Country | Annual Inflation Growth Rate |
|---|---|
| Japan | 0.9% |
| Switzerland | 2.4% |
| Israel | 3.5% |
| France | 3.6% |
| Norway | 3.7% |
| Korea | 4.1% |
| Portugal | 4.2% |
| Sweden | 4.3% |
| Finland | 4.5% |
| Denmark | 4.8% |
| Germany | 5.1% |
| United Kingdom | 5.5% |
| Ireland | 5.6% |
| Canada | 5.7% |
| Italy | 5.7% |
| Austria | 5.9% |
| Netherlands | 6.2% |
| Luxembourg | 6.6% |
| Iceland | 6.7% |
| Slovenia | 6.9% |
| Greece | 7.2% |
| Mexico | 7.3% |
| Spain | 7.6% |
| Chile | 7.7% |
| United States | 7.8% |
| Colombia | 7.9% |
| Hungary | 8.0% |
| Belgium | 8.3% |
| Poland | 8.3% |
| Latvia | 8.5% |
| Slovak Republic | 8.7% |
| Czech Republic | 9.0% |
| Estonia | 11.1% |
| Lithuania | 12.0% |
| Turkey | 14.2% |
Inflation Statistics FAQ
-
What goes into the consumer price index?
There are 18 main categories that contribute to the consumer price index (CPI). These categories are weighted differently to accurately reflect their individual effects. Here’s a breakdown of the top ten categories and their weights:
-
Shelter (32.39%)
-
Food (13.99%)
-
Transportation commodities (7.98%)
-
Energy (7.54%)
-
Medical care services (6.99%)
-
Education and communication services (6.01%)
-
Transportation services (5.05%)
-
Household furnishings and supplies (3.77%)
-
Recreation services (3.67%)
-
Apparel (2.67%)
-
-
What is the current inflation rate?
The current CORE inflation rate in the United States is 6.28%. This reflects the overall 12-month increase between 2022 and 2023. The CPI has increased by 7.7%, with various categories experiencing even greater increases.
For instance, the Energy category has seen a 12-month CPI increase of 17.6%.
-
What is the average inflation rate each year?
The average annual U.S. inflation rate is 1.23%. However, this rate can fluctuate significantly due to national and global events. For example, the economic impacts of the COVID-19 pandemic and ongoing global tensions have influenced U.S. inflation trends.
Since 2016, the average annual inflation rate has ranged between 1.25% and 2.45%. The highest year-over-year increase occurred in 2018 at 2.44%, while 2020 saw the lowest increase at just 1.25%.
-
Is inflation bad for the economy?
The answer is both yes and no. Inflation can have mixed effects on employment and economic growth, leading to a preference for a stable inflation rate. The federal government aims to maintain inflation between 1-2% for optimal employment and economic stability.
Deflation can be highly detrimental as it decreases consumer spending power, while hyperinflation, defined as inflation exceeding 50%, poses significant risks as well.
-
What year had the highest inflation rate?
The highest U.S. inflation rate ever recorded was 29.78% in 1778. This spike occurred during a period of rapid economic changes. The highest recorded inflation rate since the introduction of the CPI was 19.66% in 1917, primarily due to World War I, while the most significant inflation rate in the past 50 years occurred in 1980 at 14.6%.
-
Who benefits most from inflation?
Several groups can benefit from rising inflation:
-
Debtors. Those with debts may find it easier to repay them as inflation increases.
-
Governments with High Debts. Similar to individuals, governments with substantial debts can also benefit from inflation.
-
Owners of Physical Assets. Individuals holding property or other physical assets can see their values rise with inflation.
-
Firms that Manage Real Wages. Companies that can maintain wage levels may benefit from inflation without needing to increase pay.
-
-
Who is hurt the most from inflation?
Many individuals and groups can be negatively impacted by rising inflation:
-
Savers. Individuals who save money may find their purchasing power diminished as inflation rises.
-
Fixed Income Recipients. Retirees and others on fixed incomes may suffer as costs rise without corresponding increases in their income.
-
Borrowers on Variable Rates. Borrowers without fixed-rate loans may face increased repayment costs due to inflation fluctuations.
-
The Economy as a Whole. Sustained high inflation can destabilize the economy, leading to reduced purchasing power and potential economic imbalances.
-
-
Inflation presents both opportunities and risks for the stock market. While it can enhance the nominal value of stocks, it also introduces volatility and risk. The relationship between inflation and stock performance is complex, as decreased consumer purchasing power can negatively impact stock prices.
-
Has America ever had hyperinflation?
No, the U.S. has never experienced hyperinflation. The highest inflation rate recorded was 29.78% in 1778, which falls short of the hyperinflation threshold of 50%. Historical examples of hyperinflation include Germany’s experiences in the 1920s and Venezuela’s recent economic crisis.
Conclusion
Inflation rates in the U.S. have risen significantly, with CORE inflation increasing by 6.28% and the CPI by 7.7% over a 12-month period. This trend affects a wide range of essential goods and services, from energy and food to transportation.
While inflation is likely to persist in the coming years, it does not suggest an imminent hyperinflation crisis. Instead, consumers and businesses will need to adapt to an environment of ongoing inflationary pressures.
Sources:
-
BLS. “Consumer Price Index Summary.” Accessed on April 7th, 2022.
-
Trading Economics. “United States Core Inflation Rate.” Accessed on April 7th, 2022.
-
BLS. “Consumer Price Index.” Accessed on April 8th, 2022.
-
Pew Research Center. “As inflation soars, a look at what’s inside the Consumer Price Index.” Accessed on April 8th, 2022.
-
Statista. “Projected annual inflation rate in the United States from 2010 to 2026.” Accessed on April 8th, 2022.
-
BLS. “Producer Price Indexes.” Accessed on April 8th, 2022.
-
BLS. “Import/Export Price Indexes.” Accessed on April 8th, 2022.
-
The World Bank. “Inflation, consumer prices (annual %).” Accessed on April 8th, 2022.
-
OECD Data. “Inflation (CPI).” Accessed on April 8th, 2022.
Author
Jack Flynn is a writer for Zippia. In his professional career he’s written over 100 research papers, articles and blog posts. Some of his most popular published works include his writing about economic terms and research into job classifications. Jack received his BS from Hampshire College.