- Industry Statistics
- Wedding Industry Statistics
- Yoga Industry Statistics
- Music Industry Statistics
- Landscaping Industry Statistics
- Bicycle Industry Statistics
- Coffee Industry Statistics
- Car Rental Industry Statistics
- Home Improvement Industry Statistics
- Insurance Industry Statistics
- Supplements Industry Statistics
- Golf Industry Statistics
- Fitness Industry Statistics
- US Media And Entertainment Industry Statistics
- Firearm Industry Statistics
- Financial Services Industry Statistics
- Health And Wellness Industry Statistics
- Trucking Industry Statistics
- Wine Industry Statistics
- Pet Industry Statistics
- Mobile App Industry Statistics
- Digital Marketing Industry Statistics
- Hotel Industry Statistics
- Retail Statistics
- Robotics Industry Statistics
- Jewelry Industry Statistics
- Appointment Scheduling statistics
- Restaurant Industry Statistics
- Food Delivery Statistics
- Food Truck Industry
- Fashion Industry
- Real Estate Industry
- US Film Industry
- US Beverage Industry
- USu202fFast Food Restaurants
- US Construction Industry
- US Book Industry
- Cosmetics Industry
- US Food Retail Industry
- US Pharmaceutical Industry
- US Healthcare Industry
- Airline Industry
- Automobile Industry
- Transportation Industry Statistics
- Event Industry Statistics
- Project Management Statistics
- Oil And Gas Industry Statistics
- Nursing Home Statistics
- Nursing Shortage Statistics
- Nursing Statistics
25+ Incredible U.S. Pharmaceutical Statistics [2026]: Facts, Data, Trends And More
Pharmaceutical Research Overview: The U.S. pharmaceutical industry remains a pivotal sector in the economy, producing countless life-saving and life-enhancing medications. Below are key statistics reflecting the industry’s current landscape:
-
The U.S. pharmaceutical industry generated an estimated $600 billion in annual revenue in 2025.
-
Americans are projected to spend $670 billion on medicine in 2026.
-
The U.S. pharmaceutical market is expected to account for 48% of the global pharmaceutical market in 2026.
For detailed insights, explore the data segmented by the following categories:
The U.S. Economy | Pharmaceutical Companies | Trends + Projections | Best-Selling + Newest Drugs
General Pharmaceutical Industry Statistics
The spotlight on the pharmaceutical sector has intensified in recent years, leading to increased public interest in its global role. Here are some significant insights about the pharmaceutical industry:
-
On average, the FDA approves approximately 40 drugs each year.
-
Only about 11% of drugs submitted for clinical testing receive FDA approval.
-
Just 39% of Americans express a fair amount or a great deal of trust in pharmaceutical companies to prioritize their health interests.
-
U.S. households spend an average of $465 on over-the-counter medications annually.
-
Approximately 5.1 billion prescriptions were dispensed in the U.S. in 2025.
-
The U.S. pharmaceutical industry constitutes 48% of the global pharmaceutical market in 2026.

Pharmaceutical Industry Statistics and the Economy
The pharmaceutical sector significantly influences the economy, particularly in the wake of increased healthcare demands. Here are essential facts illustrating its economic contributions:
-
The pharmaceutical industry supports over 5 million jobs in the U.S.
While there are approximately 850,000 jobs directly within the industry, over 4 million jobs are induced or indirectly supported across various sectors.
-
There are an estimated 340,000 pharmacist jobs in the U.S.
Pharmacists play a crucial role in dispensing medications and advising patients on their safe use. They typically require a Doctor of Pharmacy (Pharm.D.) degree and must be licensed to practice.
As of 2026, pharmacists earn a median salary of $140,000 annually.
-
The pharmaceutical industry contributes an estimated $1.6 trillion to the U.S. economy.
This figure encompasses both revenue generated from pharmaceutical sales and the economic activity associated with the industry’s workforce.
-
Approximately 500,000 pharmacy technician jobs exist in the U.S.
These professionals assist licensed pharmacists in medication dispensing and require postsecondary education for certification.
The median salary for pharmacy technicians as of 2026 is $38,500 annually.
-
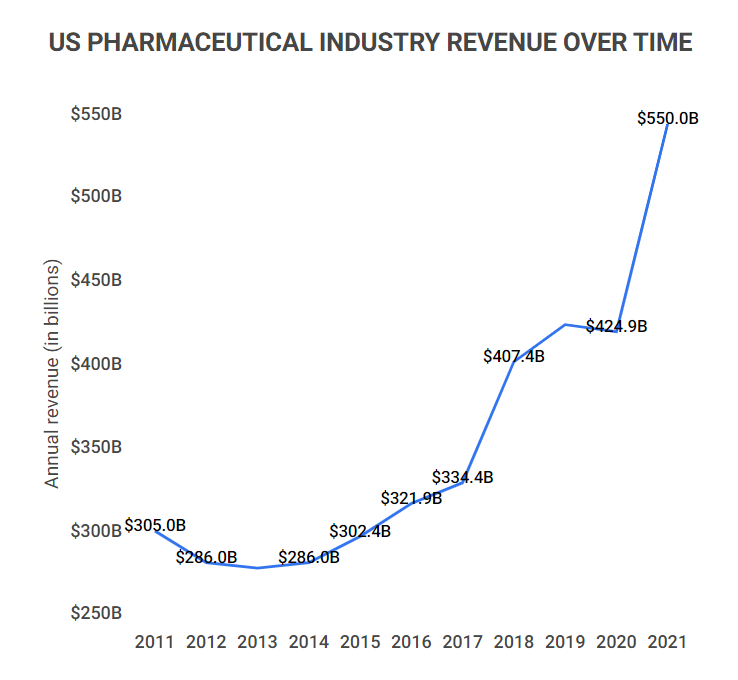
The U.S. pharmaceutical industry achieved $330 billion in domestic revenue and $130 billion in international revenue in 2021.
While domestic revenue continues to grow steadily, international revenue has seen fluctuations in recent years.
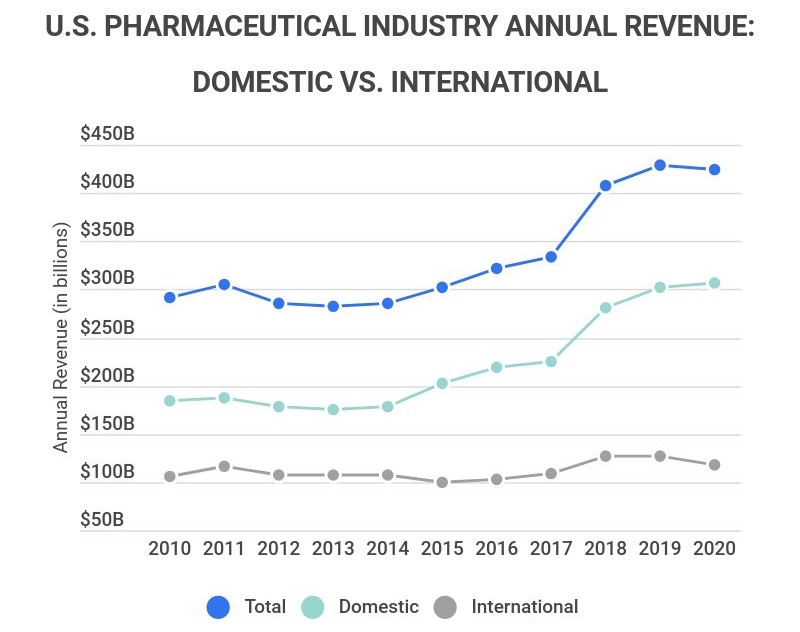
Domestic + International Revenue U.S. Pharmaceutical Industry 2010-2021
| Year | Total | Domestic | International |
|---|---|---|---|
| 2021 | $460B | $330B | $130B |
| 2020 | $424B | $307B | $117B |
| 2019 | $429B | $302B | $126B |
| 2018 | $407B | $280B | $126B |
| 2017 | $334B | $224B | $109B |
| 2016 | $321B | $218B | $103B |
| 2015 | $302B | $202B | $100B |
| 2014 | $286B | $178B | $107B |
| 2013 | $282B | $175B | $106B |
| 2012 | $286B | $178B | $107B |
| 2011 | $305B | $187B | $117B |
| 2010 | $291B | 184B | $106B |
Pharmaceutical Statistics by Company
The development of pharmaceutical drugs is complex and resource-intensive, resulting in a few dominant players in the market. Here’s the latest on the top pharmaceutical companies:
-
Pfizer remains the largest pharmaceutical company globally, with revenues of $100.3 billion in 2022.
The significant revenue surge is attributed to the company’s COVID-19 vaccine, which has reshaped Pfizer’s financial landscape.
-
The U.S. hosts five of the top ten largest pharmaceutical companies in the world.
These include Pfizer, Johnson & Johnson, AbbVie, Merck & Co., and Bristol Myers Squibb, ranked by their 2021 revenues.
-
In 2021, the U.S. pharmaceutical industry spent approximately $7 billion on advertising.
This figure focuses solely on direct-to-consumer advertising efforts, excluding lobbying and other expenditures.
-
The U.S. pharmaceutical industry invests over $150 billion in research and development annually.
This investment encompasses leading pharmaceutical research companies in the U.S. and has been on a consistent upward trajectory since 2011.
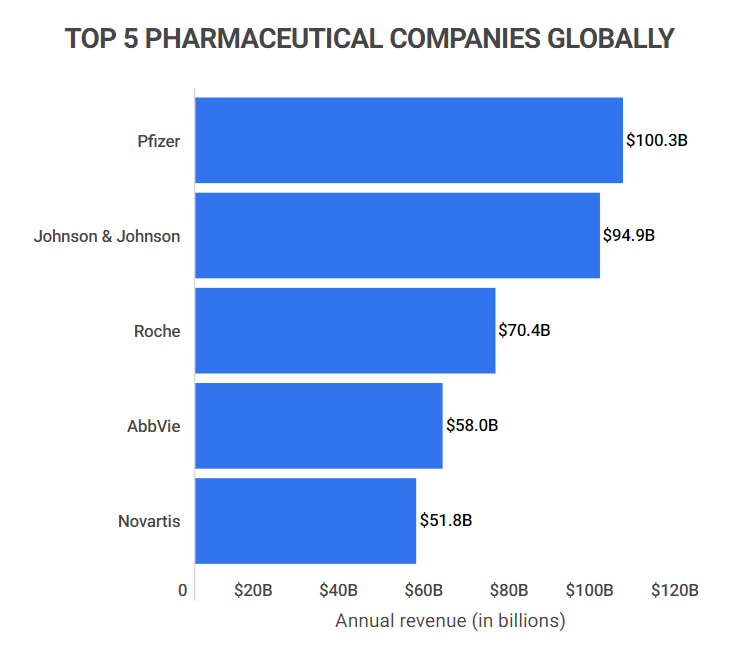
Top 5 Biggest Pharmaceutical Companies Worldwide by Revenue
| Company | 2022 Revenue |
|---|---|
| Pfizer | $100.30B |
| Johnson & Johnson | $94.94B |
| Roche | $70.44B |
| AbbVie | $58.05B |
| Novartis | $51.83B |
Pharmaceutical Industry Trends and Projections
The pharmaceutical sector has experienced steady growth, particularly during the years following the pandemic. Here are some notable trends and forecasts:
-
In 2026, the U.S. is projected to spend $670 billion on medicine.
This represents a significant increase from the $633.5 billion spent in 2022 and aligns with the trend of rising healthcare expenditures.
-
In 2021, approximately 5.8 billion prescription medications were dispensed in the U.S.
This upward trend in prescriptions underscores the growing need for medication and healthcare services.
-
Most drugs currently undergoing clinical testing are aimed at treating chronic conditions, including cancer and neurological disorders.
These therapeutic areas dominate the current drug development landscape, reflecting ongoing public health challenges.
Pharmaceutical Statistics by Drugs
The types of pharmaceutical drugs produced and distributed often align with prevailing health concerns. Here are some insights into pharmaceutical drugs:
-
In 2025, BioNTech/Pfizer’s Comirnaty was the top-selling drug globally.
With sales reaching $36.9 billion, Comirnaty has shifted the competitive landscape, impacting other top-selling drugs like AbbVie’s Humira.
-
Pfizer’s Lipitor remains the top-selling drug in the U.S. over its lifetime.
From 1992 to 2017, Lipitor generated $94.67 billion in sales, although recent competitors have emerged since its patent expiration.
-
Immunology was the therapeutic drug class with the highest sales revenue in 2021.
This class alone generated approximately $80 billion in sales, followed closely by diabetes medications.
-
The FDA approved 37 new drugs in 2022.
This figure reflects the ongoing innovation within the industry and regulatory scrutiny.
-
It is estimated that developing a new prescription medication costs about $2.6 billion.
This figure incorporates expenses related to research, development, and FDA approval processes.
Top 5 Best-Selling Drugs by 2021 Sales
| Drug | 2021 Sales |
|---|---|
| Comirnaty | $36.9B |
| Humira | $20.7B |
| Spikevax | $17.7B |
| Keytruda | $17.2B |
| Revlimid | $12.8B |
Pharmaceutical Industry Statistics FAQ
-
When did the U.S. pharmaceutical industry start?
The U.S. pharmaceutical industry began to take shape in the 19th century with traveling salesmen and local pharmacists.
Early salesmen hawked unregulated concoctions, which led to the establishment of standards and regulations for drug safety and efficacy.
-
Who were key figures in establishing the modern U.S. pharmaceutical industry?
Pioneers like Charles Pfizer, Charles Erhardt, and Eli Lilly significantly shaped the industry.
They aimed to produce safe, standardized drugs distributed by medical professionals rather than salesmen.
-
Which organizations can approve new drugs in the U.S.?
The U.S. Food and Drug Administration (FDA) is the sole organization responsible for approving new drugs in the country.
-
What is a therapeutic class?
A therapeutic class is a category of drugs designed to treat a specific medical condition.
-
How big is the U.S. pharmaceutical industry?
The U.S. pharmaceutical industry is valued at $600 billion as of 2025.
-
Is the pharmaceutical industry growing?
Yes, the pharmaceutical industry is experiencing growth.
-
How much is the pharmaceutical industry worth?
The pharmaceutical industry is worth approximately $600 billion.
Conclusion
The U.S. pharmaceutical industry plays a crucial role in the global healthcare landscape and significantly contributes to the U.S. economy by generating revenue and sustaining jobs.
While consumers interact with the industry primarily through advertisements and medication purchases, the extensive research and development processes behind these products often go unnoticed.
As the industry adapts to evolving health concerns, new best practices, and technological advancements, it remains one of the most dynamic and impactful sectors in the U.S.
References
-
Congressional Budget Office. “Research and Development in the Pharmaceutical Industry.” Accessed on August 27, 2021.
-
Axios. “Axios-Ipsos Poll: Distrusting Big Pharma and the FDA.” Accessed on August 27, 2021.
-
CHPA. “The Value of OTC Medicines to the U.S. Healthcare System.” Accessed on August 27, 2021.
-
Statista. “Leading 20 U.S. Therapy Areas Based on Drug Spending in 2019.” Accessed on August 27, 2021.
-
PhRMA. “The Economic Impact of the U.S. Biopharmaceutical Industry: 2017 National and State Estimates.” Accessed on August 27, 2021.
-
U.S. Bureau of Labor Statistics. “Occupational Outlook Handbook: Pharmacists.” Accessed on February 20, 2023.
-
U.S. Bureau of Labor Statistics. “Occupational Outlook Handbook: Pharmacy Technicians” Accessed on February 20, 2023.
-
SelectUSA. “Biopharmaceutical Spotlight.” Accessed on August 27, 2021.
-
Fierce Pharma. “Special Report: Top 20 Pharma Companies by 2019 Revenue.” Accessed on August 27, 2021.
-
Statista. “Direct-to-Consumer Spending of the Pharmaceutical Industry in the United States From 2012 to 2020.” Accessed on August 27, 2021.
-
Statista. “Research and Development Expenditure of Total U.S. Pharmaceutical Industry From 1995 to 2019 (in Billion U.S. Dollars).” Accessed on August 27, 2021.
-
Statista. “Projected Expenditure on Medicine of Selected Countries Worldwide in 2025.” Accessed on August 27, 2021.
-
Statista. “Total Nominal Spending on Medicines in the U.S. From 2002 to 2019.” Accessed on August 27, 2021.
-
IQVIA. “Medicine Use and Spending in the U.S.” Accessed on August 27, 2021.
-
Fierce Pharma. “Special Report: Top 20 Drugs by 2020 Sales – Humira.” Accessed on August 27, 2021.
-
Fierce Pharma. “From Old Behemoth Lipitor to New King Humira: Best-Selling U.S. Drugs Over 25 Years.” Accessed on August 27, 2021.
-
Statista. “Global Pharmaceutical Industry – Statistics and Facts.” Accessed on August 27, 2021.
-
FDA. “Novel Drug Approvals for 2020.” Accessed on August 27, 2021.
-
FDA. “Novel Drug Approvals for 2019.” Accessed on August 27, 2021.
-
Policy Medicine. “A Tough Road: Cost To Develop One New Drug is $2.6 Billion; Approval Rate for Drugs Entering Clinical Development is Less Than 12%.” Accessed on August 27, 2021.
-
Literary Hub. “A Brief History of American Pharma: From Snake Oil to Big Money.” Accessed on August 27, 2021.
-
NIHD. “How Are Drugs Approved for Use in the United States?” Accessed on August 27, 2021.
-
Law Insider. “Therapeutic Class Definition.” Accessed on August 27, 2021.
-
Statista. “Domestic and International Revenue of the U.S. Pharmaceutical Industry Between 1975 and 2021.” Accessed on February 21, 2023.
-
Statista. “Total Number of Retail Prescriptions Filled Annually in the United States From 2013 to 2025 (In Billions).” Accessed on February 21, 2023.
-
World Atlas. “Biggest Pharmaceutical Markets in the World By Country.” Accessed on February 21, 2023.
-
Statista. “Leading Pharmaceutical Products By Sales Worldwide in 2021.” Accessed on February 21, 2023.
-
Statista. “Market Share of Top 10 National Pharmaceutical Markets Worldwide in 2021.” Accessed on February 21, 2023.
-
Fierce Pharma. “The Top 20 Pharma Companies By 2021 Revenue.” Accessed on February 21, 2023.
-
FDA. “Novel Drug Approvals for 2021.” Accessed on February 21, 2023.
-
FDA. “Novel Drug Approvals for 2022.” Accessed on February 21, 2023.
- Industry Statistics
- Wedding Industry Statistics
- Yoga Industry Statistics
- Music Industry Statistics
- Landscaping Industry Statistics
- Bicycle Industry Statistics
- Coffee Industry Statistics
- Car Rental Industry Statistics
- Home Improvement Industry Statistics
- Insurance Industry Statistics
- Supplements Industry Statistics
- Golf Industry Statistics
- Fitness Industry Statistics
- US Media And Entertainment Industry Statistics
- Firearm Industry Statistics
- Financial Services Industry Statistics
- Health And Wellness Industry Statistics
- Trucking Industry Statistics
- Wine Industry Statistics
- Pet Industry Statistics
- Mobile App Industry Statistics
- Digital Marketing Industry Statistics
- Hotel Industry Statistics
- Retail Statistics
- Robotics Industry Statistics
- Jewelry Industry Statistics
- Appointment Scheduling statistics
- Restaurant Industry Statistics
- Food Delivery Statistics
- Food Truck Industry
- Fashion Industry
- Real Estate Industry
- US Film Industry
- US Beverage Industry
- USu202fFast Food Restaurants
- US Construction Industry
- US Book Industry
- Cosmetics Industry
- US Food Retail Industry
- US Pharmaceutical Industry
- US Healthcare Industry
- Airline Industry
- Automobile Industry
- Transportation Industry Statistics
- Event Industry Statistics
- Project Management Statistics
- Oil And Gas Industry Statistics
- Nursing Home Statistics
- Nursing Shortage Statistics
- Nursing Statistics
Author
Chris Kolmar is a co-founder of Zippia and the editor-in-chief of the Zippia career advice blog. He has hired over 50 people in his career, been hired five times, and wants to help you land your next job. His research has been featured on the New York Times, Thrillist, VOX, The Atlantic, and a host of local news. More recently, he's been quoted on USA Today, BusinessInsider, and CNBC.