- Tech Industry Statistics
- MFA Statistics
- Streaming Services Statistics
- Mobile Vs. Desktop Usage Statistics
- AI Statistics
- Live Streaming Statistics
- Zoom Meeting Statistics
- Cord Cutting Statistics
- Digital Transformation Statistics
- Virtual Reality Statistics
- How Fast Is Technology Advancing
- Mobile Commerce Statistics
- SaaS Statistics
- Machine Learning Statistics
- Diversity In High Tech
- Cyber Security Statistics
- Ecommerce Statistics
- Tech Industry
- Gaming Industry
- Renewable Energy Job Creation
- Smartphone Industry
- Cybercrime Statistics
- Amazon Statistics
- Personalization Statistics
Research Summary: In an era where mobile technology continues to dominate our daily interactions, the meteoric rise of mobile commerce (m-commerce) is both expected and impactful. For marketers and business owners, understanding the nuances of m-commerce is crucial for maximizing profits. As of 2026, our extensive research reveals the following insights about m-commerce in the U.S.:
-
As of 2026, 81% of smartphone users have utilized their mobile devices to make purchases.
-
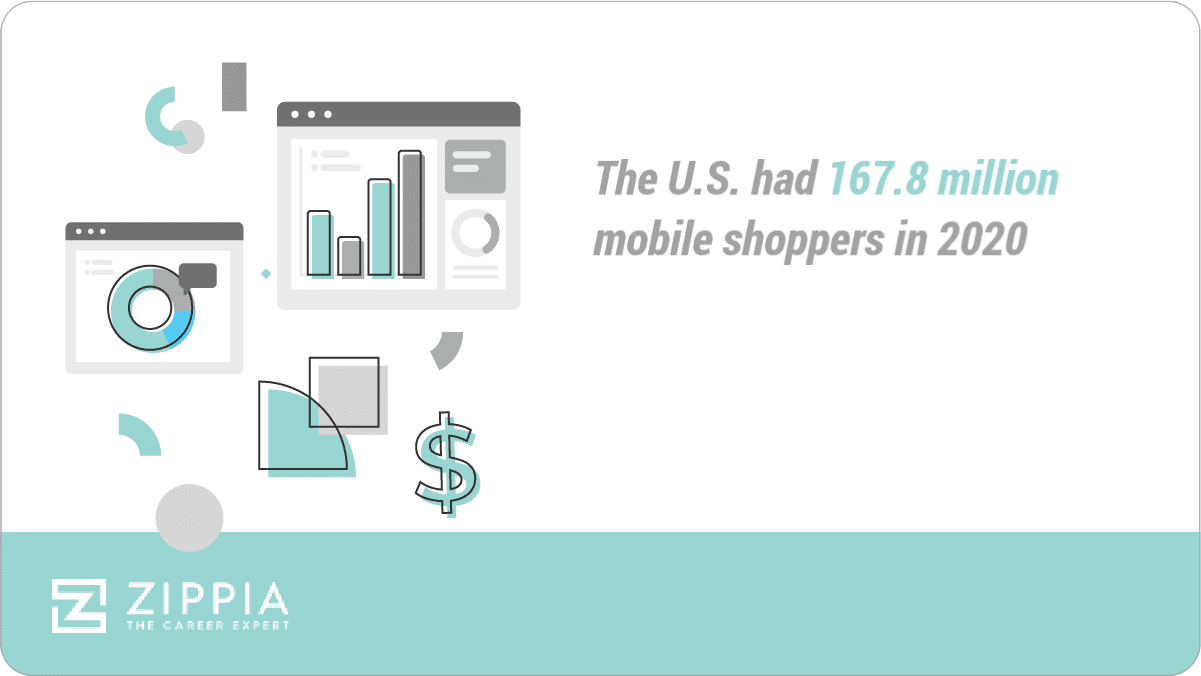
By 2025, there were approximately 190 million mobile shoppers in the U.S.
-
U.S. revenue generated by m-commerce reached $600 billion in 2025.
-
M-commerce now comprises 75% of total e-commerce.
-
Smartphone commerce alone is projected to account for 50% of all e-commerce sales by 2026.
-
60% of U.S. consumers have used a mobile retail application to research products.
-
U.S. m-commerce is projected to experience an impressive CAGR of 36% through 2026.
For deeper insights, we’ve categorized the data into the following sections:
Mobile Shopper | M-Commerce Optimization | Trends and Projections
General Mobile Commerce Statistics
Given the clear significance of mobile commerce in the United States, the following statistics highlight general trends in the marketplace. These insights will help both marketers and consumers grasp the current landscape. According to our findings:
-
As of 2026, the m-commerce market constitutes nearly 75% of the overall e-commerce landscape.
This marks a stunning increase from 2016 when m-commerce only represented 52.4% of the e-commerce market. As the reliance on mobile devices continues to grow, we can anticipate this trend to persist.
-
Global m-commerce revenue has reached $4.5 trillion in 2025.
This reflects a significant increase from 2021, indicating the U.S. market contributes approximately 12-13% of global m-commerce revenues.
-
The average U.S. consumer spends close to $120 per m-commerce transaction.
This average breaks down to approximately $110 for mobile phone purchases and $130 for tablet purchases.
-
Over 61% of annual retail e-commerce sales in the U.S. are derived from m-commerce.
This represents a 12% increase from the previous forecast. Furthermore, m-commerce now comprises roughly 8% of all retail sales, projected to grow to 12% by 2026.
-
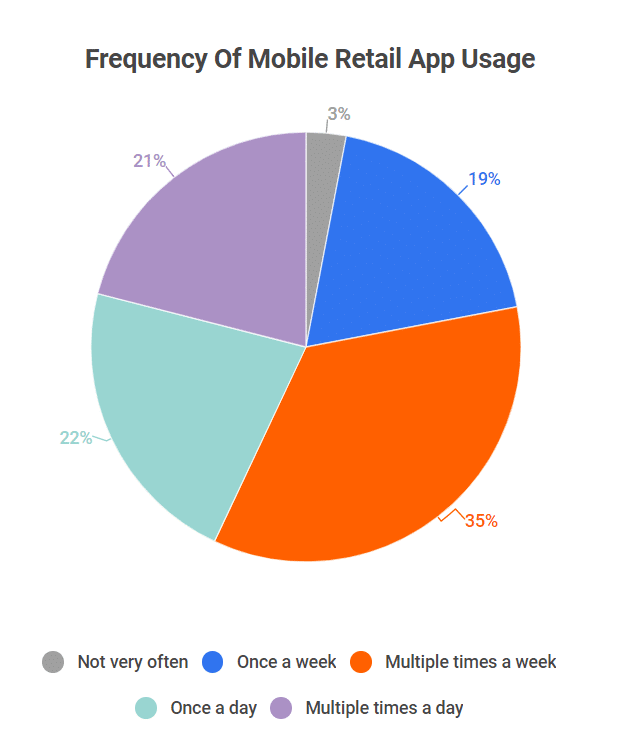
40% of mobile shoppers report using a mobile retail app multiple times a week. Moreover, 30% of shoppers utilize mobile retail apps at least once a day, while 25% do so multiple times a day.
Frequency Of Mobile Retail App Usage
Frequency Percent of mobile shoppers Not very often 4% Once a week 20% Multiple times a week 40% Once a day 30% Multiple times a day 25%
Mobile Shopper Statistics
Mobile shopping’s popularity is largely driven by consumer preferences. The convenience of m-commerce makes it increasingly favored among U.S. shoppers. Here are the key statistics:
-
63% of the U.S. population are mobile buyers.
This translates to approximately 190 million mobile shoppers in the U.S., a number expected to rise to 215 million by 2026. This growth is significant, even when considering the age demographics of the population.
-
Mobile devices hold a 51% market share for digital purchases compared to desktops.
Smartphones account for 48% of this market, while tablets represent 3%. Desktop purchases now comprise 49% of the market, indicating a substantial shift from 2016 when mobile’s market share was only 31.2%.
-
58% of consumers make purchases on their phones after discovering products on social media.
Research indicates that retailers with an active social media presence generate 35% more sales than those without. Furthermore, up to 92% of consumers are likely to buy from brands they follow on social media.
-
Over 65% of consumers utilize social media for product and service research.
Social media significantly influences mobile buyers, with 52% of consumers relying on social media recommendations. As of 2023, social media impacts 75% of consumer purchasing decisions.
-
Approximately 45% of Cyber Monday sales are made via mobile devices.
Cyber Monday shoppers spent nearly $12 billion in 2022, with mobile purchases accounting for 45% of total sales.
M-Commerce Optimization Statistics
To fully leverage m-commerce, optimization is essential. Here’s what our research reveals about m-commerce optimization:
-
Mobile devices generate 67% of all e-commerce traffic.
This is noteworthy, as desktop traffic continues to convert at a higher rate. The traffic ratio between mobile and desktop stands at 67/33, while the sales ratio is roughly 51/49.
-
Mobile shoppers account for 62% of organic search engine visits.
This highlights the critical importance of SEO optimization for marketers and businesses.
-
90% of mobile shoppers have encountered at least one negative shopping experience.
Common issues include navigation difficulties (55%), inadequate image quality (50%), security concerns (45%), and checkout challenges (30%). This has led to a 40% cart abandonment rate among affected customers.
-
35% of mobile shoppers who experience a negative interaction will switch to a competitor immediately.
Additionally, a significant portion of these users, 32%, indicated they would not return to the site that provided the poor experience, while 30% stated they would wait at least six months before revisiting.
Mobile Commerce Trends and Projections
While it’s evident that m-commerce is on the rise, it is crucial to appreciate the extent to which mobile devices have transformed the e-commerce landscape. Here are some key trends and projections for the future of m-commerce:
-
From 2021 to 2025, global m-commerce sales surged from $3.56 trillion to $4.5 trillion.
This translates to year-on-year growth rates of 25-35%, reflecting a total growth of approximately 26% within this timeframe.
-
From 2021 to 2026, the share of U.S. m-commerce sales in e-commerce will rise from 53.9% to over 61%.
This shift indicates that more than half of all online purchases are now made via mobile devices.
-
By 2026, m-commerce is projected to comprise 12% of total retail sales in the U.S.
This marks significant growth from 3.5% in 2018, signaling a remarkable shift in consumer purchasing behavior.
-
The number of mobile shoppers in the U.S. is expected to reach 215 million by 2026.
This signifies a notable increase from 190 million mobile shoppers in 2025, underscoring the appeal of mobile shopping.
-
U.S. m-commerce is projected to experience a substantial CAGR of 36% between 2020 and 2026.
This growth trajectory indicates that more consumers are opting for mobile devices as their primary means of making purchases.
Mobile Commerce FAQ
-
What percentage of e-commerce is mobile?
75% of the e-commerce market is mobile. As of 2026, the m-commerce market share comprises nearly 75% of total e-commerce, with approximately 61% of all e-commerce sales being mobile sales.
These figures represent a significant increase from just a few years ago, with the 75% market share being a remarkable growth from 52.4% in 2016.
-
How many people use mobile commerce in the U.S.?
63% of the U.S. population are mobile buyers. This equates to approximately 190 million mobile shoppers, a number expected to grow to over 215 million by 2026.
-
How large is the U.S. mobile commerce market?
The U.S. mobile commerce market continues to expand. As of 2025, m-commerce sales accounted for 8% of total retail sales. Furthermore, the market is projected to exceed 12% by 2026.
In 2025, U.S. m-commerce generated approximately $600 billion, contributing significantly to global m-commerce revenues.
-
How fast is mobile commerce growing?
The m-commerce market is experiencing rapid growth. Between 2020 and 2026, U.S. m-commerce is projected to witness a remarkable CAGR of 36%.
Globally, m-commerce sales have surged from $3.56 trillion in 2021 to $4.5 trillion in 2025, with year-on-year growth rates remaining strong.
Conclusion
M-commerce has emerged as a dominant purchasing choice for consumers and an essential strategy for marketers. By 2026, 63% of the U.S. population are mobile buyers, and 81% of smartphone users make purchases via their devices.
This growing trend is compelling marketers to tap into the mobile market vigorously.
The interplay of advancing technology, consumer demand, and strategic marketing has fueled m-commerce’s rapid growth over the last few years. From 2021 to 2026, the share of U.S. m-commerce sales in the e-commerce realm is projected to rise from 53.9% to over 61%.
As the number of mobile shoppers in the U.S. is expected to climb from 190 million to 215 million by 2026, now is an opportune moment for marketers to engage with the m-commerce space. With effective optimization, businesses can capitalize on the burgeoning m-commerce market.
Sources:
-
Oberlo. “Mobile Commerce Sales in 2025.” Accessed on December 21st, 2025.
-
Statista. “Mobile retail e-commerce sales worldwide from 2021 to 2025.” Accessed on December 21st, 2025.
-
Statista. “Mobile commerce sales as percentage of total retail sales in the United States from 2021 to 2026.” Accessed on December 21st, 2025.
-
Statista. “Number of mobile buyers in the United States from 2021 to 2026.” Accessed on December 21st, 2025.
-
Statcounter. “Desktop vs Mobile vs Tablet Market Share United States Of America.” Accessed on December 22nd, 2025.
-
MarketingDive. “92% of people buy from brands they follow on social media, study says.” Accessed on December 22nd, 2025.
-
DigitalTransactions. “In Cyber Monday’s Shopping Frenzy, Smart Phones Continued to Dominate.” Accessed on December 22nd, 2025.
-
The Drum. “Mobile accounts for 67% of all e-commerce traffic – so why are mobile sales still lagging?” Accessed on December 22nd, 2025.
-
Statista. “Mobile share of organic search engine visits in the United States from 2021 to 2026.” Accessed on December 22nd, 2025.
-
Keepitusable. “90% of mobile shoppers have negative user experiences.” Accessed on December 22nd, 2025.
-
Appinventiv. “Future of Mobile Commerce: Stats & Trends to Know in 2021-2026.” Accessed on December 23rd, 2025.
-
GlobalNewswire. “Global M-Commerce Market Size Will Reach USD 4,500 Million by 2026: Facts & Factors.” Accessed on December 23rd, 2025.
-
Statista. “Frequency of mobile retail app usage according to smartphone shoppers in the United States as of 2025.” Accessed on February 27th, 2026.
- Tech Industry Statistics
- MFA Statistics
- Streaming Services Statistics
- Mobile Vs. Desktop Usage Statistics
- AI Statistics
- Live Streaming Statistics
- Zoom Meeting Statistics
- Cord Cutting Statistics
- Digital Transformation Statistics
- Virtual Reality Statistics
- How Fast Is Technology Advancing
- Mobile Commerce Statistics
- SaaS Statistics
- Machine Learning Statistics
- Diversity In High Tech
- Cyber Security Statistics
- Ecommerce Statistics
- Tech Industry
- Gaming Industry
- Renewable Energy Job Creation
- Smartphone Industry
- Cybercrime Statistics
- Amazon Statistics
- Personalization Statistics
Author
Jack Flynn is a writer for Zippia. In his professional career he’s written over 100 research papers, articles and blog posts. Some of his most popular published works include his writing about economic terms and research into job classifications. Jack received his BS from Hampshire College.