- Workplace Statistics
- Time Management Statistics
- Employee Wellness Statistics
- Employment Discrimination Statistics
- Employee Recognition Statistics
- Employee Referral Statistics
- Workplace Violence Statistics
- Gamification Statistics
- Employee Feedback Statistics
- Agile Statistics
- Productivity Statistics
- Meeting Statistics
- Cell Phones At Work Statistics
- Social Media At Work Statistics
- Workplace Injury Statistics
- Workplace Stress Statistics
- Leadership Statistics
- Workplace Collaboration Statistics
- Job Satisfaction Statistics
- Paid Holiday Statistics
- Communication In The Workplace Statistics
- Wasting Time At Work Statistics
- 4-day Workweek Statistics
Research Summary. In 2026, the landscape of productivity in the U.S. workplace continues to evolve, reflecting shifts in employee engagement, work environments, and technology. Understanding the current state of productivity is essential for both employees and employers. Here’s what our latest research reveals:
-
The average employee is productive for 2 hours and 53 minutes a day, which accounts for only 31% of the average 8-hour workday.
-
At least 41% of workers report that stress negatively impacts their productivity.
-
On average, remote workers are 13% more productive than their in-office counterparts, with overall productivity in the U.S. showing a slight increase of 5% recently.
-
Employees might spend up to 32% of their workday on social media, costing employers approximately $28 billion annually.
-
It takes an average of 23 minutes and 15 seconds for employees to refocus on a task after being distracted.
-
The average office employee experiences distractions every 3 minutes.
For further insights, we categorized the data into these sections:
Employee | Employer | Top Problems | Over Time
General Employee Productivity Statistics
While productivity levels can vary across different roles and industries, several factors contribute to employee performance. Here are key findings from our research:
-
Engaged employees are 21% more productive.
High engagement also leads to a 41% reduction in absenteeism, 59% lower turnover rates, and 28% less internal theft.
-
While the average employee is productive for 60% of their workday, office workers average only 31% productivity.
This translates to about 4.8 hours of productive work daily for all employees, but only 2 hours and 53 minutes for office workers, equating to just 12.5 hours weekly.
-
Freelance workers can be productive for up to 87% of their workday.
Assuming a freelancer works five days a week, they average 36 hours weekly, resulting in about 7 hours of productive work daily.
Self-Reported Employee Productivity Statistics
Despite the objective measures of productivity, employees often perceive their own productivity differently. Here’s what they report:
-
Only 7% of employees feel productive in their work environment.
This aligns with the average productivity of 2 hours and 53 minutes per day, indicating that many employees struggle with distractions throughout their work hours.
-
66% of employees believe they would be more productive working from home.
This belief stems from desires for fewer interruptions (76%), reduced commuting stress (70%), and avoidance of office politics (69%).
-
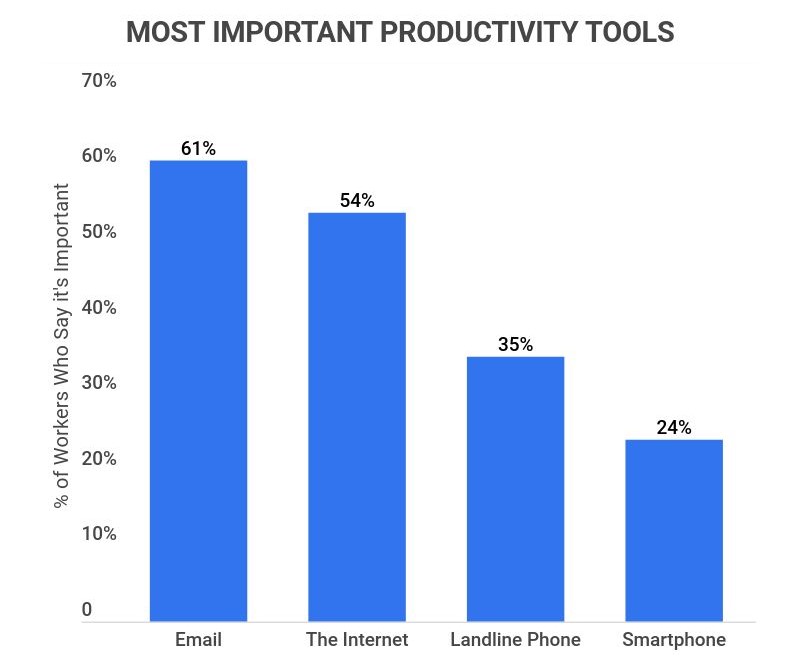
46% of employees feel that digital tools enhance their productivity.
Only 7% think technology has hindered their productivity, with email (61% deeming it crucial) and the internet (54%) identified as the most beneficial tools.
Employer Productivity Statistics
Understanding employee perspectives is crucial for employers looking to improve productivity. Here’s how employers view the current productivity landscape:
-
Productive companies enjoy operating margins that are 30-50% higher than their less productive peers.
Research indicates that the most efficient companies can be up to 40% more productive compared to their counterparts, emphasizing the importance of workplace productivity beyond mere efficiency.
-
76% of employees believe implementing wearable tech could enhance productivity.
However, there are concerns about privacy regarding how employers might use data from such devices.
-
Unproductive meetings waste 24 billion hours each year.
At least 37% of employees cite unproductive meetings as the top cost to their organizations, resulting in a significant loss of productive work hours.
-
The average corporate employee dedicates 4 hours weekly to meeting preparation and attendance.
With 54% reporting that meetings often exceed 30 minutes, many employees agree that the time spent in meetings often yields little benefit.
Top Productivity Problems
To tackle productivity issues effectively, it’s essential to identify the primary causes behind decreased productivity. Here are the key challenges:
-
Multitasking can diminish productivity by as much as 40%.
The notion of multitasking is largely a myth, as 98% of people struggle to do it effectively. Therefore, it’s unsurprising that attempts at multitasking can harm productivity.
-
Less than 25% of employees prefer teamwork.
This could affect productivity, especially given that employees report a 50% increase in time spent on meetings, calls, and emails over the past five years, consuming at least 80% of their work hours.
-
Employees spend around 32% of their workday on social media, averaging 2.35 hours daily.
Facebook remains a significant contributor to productivity losses, costing employers an estimated $28 billion yearly.
-
Checking social media is the most prevalent workplace distraction, with 47% of employees engaging during work hours.
Other distractions include reading news websites (45%), discussing personal activities (38%), making beverages (31%), and taking smoking breaks (28%).
-
80% of employees report stress due to poor communication within their companies.
This figure has risen by 30% since 2018, with communication barriers costing organizations an average of $26,000 annually.
-
70% of employees admit to feeling distracted at work.
At least 16% say they are almost always distracted, and 54% feel they are not performing to their potential.
-
Refocusing on a task after a distraction takes an average of 23 minutes and 15 seconds.
With distractions occurring every three minutes, it becomes clear why productivity remains low.

Employee Productivity Over Time Statistics
Despite improvements in productivity over time, the rise of technology has introduced new distractions. Nonetheless, Americans are now working more productively than ever. Looking ahead, here are some key productivity trends:
-
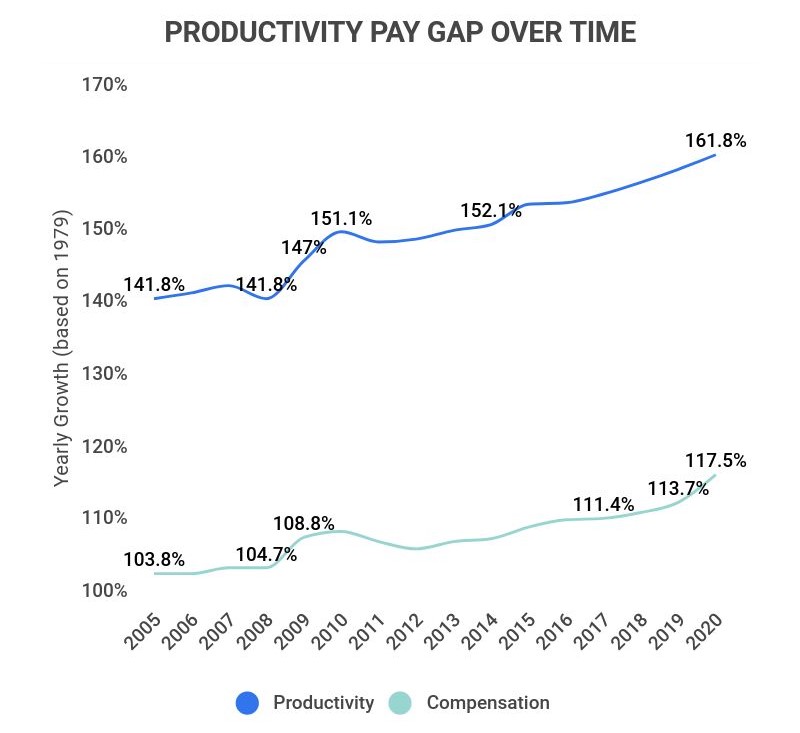
Productivity has surged by 61.8% from 1979 to 2020.
However, this increase has not corresponded with wage growth, which has only risen by 17.5%. Much of this productivity growth is attributed to technology, even as distractions have intensified.
-
The Productivity Management Software Market is anticipated to grow at a CAGR of 14.2% from 2021 to 2028.
This tech-based market currently stands at $42.62 billion and is expected to reach $119.69 billion by 2028.
-
Microsoft 365 remains the dominant productivity software.
This suite includes applications like Word, Excel, PowerPoint, and Outlook, all designed to facilitate remote work and data management.
Productivity Statistics FAQ
-
How productive is the average American worker?
The average American worker is productive for only 2 hours and 53 minutes a day, which is just 31% of the average 8-hour workday. Only 7% of employees feel productive in their work environment.
However, it’s important to note that productivity has increased overall by 61.8%.
-
Productivity is assessed by comparing the output of goods and services to the inputs used in their production. This measurement is primarily conducted by the Bureau of Labor Statistics (BLS).
Labor productivity specifically refers to the ratio of output to the hours invested in creating that output.
-
What is a good productivity percentage?
A good productivity percentage ranges from 70-75%. This indicates that employees spend 70% or more of their time actively working, allowing for optimal profit while maintaining a healthy work-life balance.
However, many Americans only reach a maximum productivity of 60%, with office workers at a low of 31% and freelancers at an impressive 87%.
-
What does a productivity expectation of 75% mean?
A productivity expectation of 75% suggests that employees are not overworking themselves, allowing for breaks and downtime. This balance helps them respond effectively to increased demands without burnout.
For instance, an employee working at 75% will have time for vacations and short breaks, leading to sustained energy and better overall productivity.
-
What is a productivity analysis?
A productivity analysis collects data to identify opportunities for improvement. Employers use these analyses to pinpoint strengths and weaknesses among their workforce.
Insights from these studies can help businesses eliminate non-valuable tasks and streamline operations.
-
How do you calculate productivity increase?
Calculating productivity increases involves a few straightforward steps. For example, if a company instituted new policies in 2021, they could determine productivity changes as follows:
-
Calculate current productivity: Number of units completed ÷ hours spent (e.g., in 2021, six units completed ÷ 3 hours = two units produced per hour)
-
Calculate previous productivity using the same method: in 2020, six units ÷ 4 hours = 1.5 units produced per hour
-
Subtract the old rate from the new rate: 2 – 1.5 = 0.5 production improvement
-
Calculate the percentage difference: Production improvement ÷ Old production rate x 100 (e.g., 0.5 ÷ 1.5 = 0.33 x 100 = 33%)
In this scenario, the improvements lead to an increase in production of 33%.
-
Conclusion
In 2026, Americans are experiencing a paradox of heightened productivity alongside increased distractions. While productivity has risen by 61.8% since 1979, the average worker remains productive for only 2 hours and 53 minutes each day.
Technology plays a crucial role in this dynamic. Productivity software like Microsoft 365 facilitates efficient workflows, and the productivity management software market is projected to grow by at least 14.2% through 2028.
However, with 47% of employees admitting to checking social media at work, averaging 2 hours and 35 minutes daily (32% of their workday), the distraction problem remains significant.
Employers must address this challenge to enhance workplace productivity. Encouraging remote work and leveraging insights from freelance workers, who are productive for 87% of their workdays, could provide valuable strategies for improvement.
Sources:
-
Forbes. “Employee Engagement And Employee Productivity Aren’t The Same Thing — Here’s How To Boost Both.” Accessed on October 25th, 2021.
-
Vouchercloud. “How Many Productive Hours in a Work Day? Just 2 Hours, 23 Minutes…” Accessed on October 25th, 2021.
-
Yahoo!Finance. “Freelancers work more hours than the average American does.” Accessed on October 25th, 2021.
-
Forbes. “Report: Only 7% Of Workers Feel Productive During Regular Work Hours.” Accessed on October 25th, 2021.
-
Pew Research Center. “Technology’s Impact on Workers.” Accessed on October 25th, 2021.
-
HBR. “Great Companies Obsess Over Productivity, Not Efficiency.” Accessed on October 25th, 2021.
-
CITYA.M. “Employers want to use wearable tech to track the health, sleep, fitness and productivity of the office.” Accessed on October 25th, 2021.
-
Doodle. “The State of Meetings 2019.” Accessed on October 25th, 2021.
-
BOOQED. “Minutes (Wasted) of Meeting: 50 Shocking Meeting Statistics.” Accessed on October 25th, 2021.
-
Forbes. “Want To Be More Productive? Stop Multi-Tasking.” Accessed on October 25th, 2021.
-
Microsoft. “New survey explores the changing landscape of teamwork.” Accessed on October 25th, 2021.
-
ETCIO. “Employees spend over 32% of their time on social media daily for personal work: study.” Accessed on October 25th, 2021.
-
Marlin. “The Hidden Costs of Employee Miscommunication.” Accessed on October 25th, 2021.
-
Lifehack. “7 Most Common Distractions at Work (And How to Tackle Them).” Accessed on October 25th, 2021.
-
The Washington Post. “Work interruptions can cost you 6 hours a day. An efficiency expert explains how to avoid them.” Accessed on October 26th, 2021.
-
EPI. “The Productivity–Pay Gap.” Accessed on October 25th, 2021.
-
Grand View Research. “Productivity Management Software Market Report, 2021-2028.” Accessed on October 26th, 2021.
-
Techradar.pro. “Best productivity tools of 2021.” Accessed on October 26th, 2021.
- Workplace Statistics
- Time Management Statistics
- Employee Wellness Statistics
- Employment Discrimination Statistics
- Employee Recognition Statistics
- Employee Referral Statistics
- Workplace Violence Statistics
- Gamification Statistics
- Employee Feedback Statistics
- Agile Statistics
- Productivity Statistics
- Meeting Statistics
- Cell Phones At Work Statistics
- Social Media At Work Statistics
- Workplace Injury Statistics
- Workplace Stress Statistics
- Leadership Statistics
- Workplace Collaboration Statistics
- Job Satisfaction Statistics
- Paid Holiday Statistics
- Communication In The Workplace Statistics
- Wasting Time At Work Statistics
- 4-day Workweek Statistics
Author
Jack Flynn is a writer for Zippia. In his professional career he’s written over 100 research papers, articles and blog posts. Some of his most popular published works include his writing about economic terms and research into job classifications. Jack received his BS from Hampshire College.