- Tech Industry Statistics
- MFA Statistics
- Streaming Services Statistics
- Mobile Vs. Desktop Usage Statistics
- AI Statistics
- Live Streaming Statistics
- Zoom Meeting Statistics
- Cord Cutting Statistics
- Digital Transformation Statistics
- Virtual Reality Statistics
- How Fast Is Technology Advancing
- Mobile Commerce Statistics
- SaaS Statistics
- Machine Learning Statistics
- Diversity In High Tech
- Cyber Security Statistics
- Ecommerce Statistics
- Tech Industry
- Gaming Industry
- Renewable Energy Job Creation
- Smartphone Industry
- Cybercrime Statistics
- Amazon Statistics
- Personalization Statistics
Research Summary. Renewable energy is a critical focus in U.S. culture and industry, shaping politics, retail, construction, transportation, and technology.
The clean energy sector continues to expand significantly within the American economy. Here are some key statistics on renewable energy jobs:
-
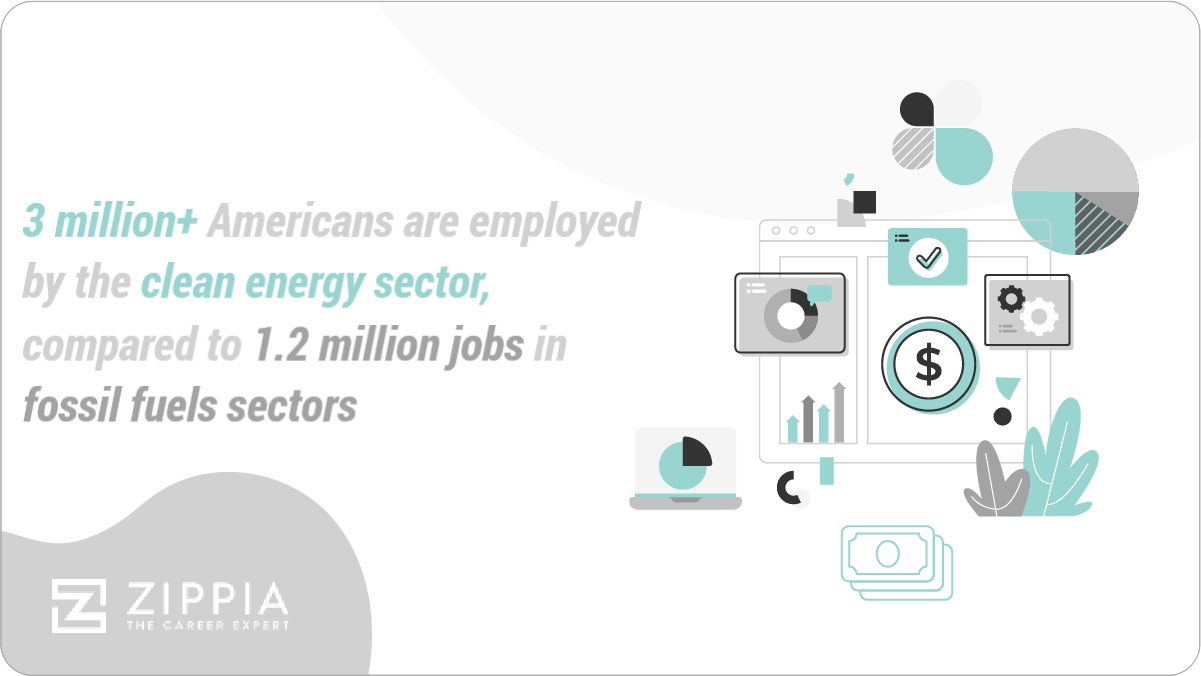
3.2 million Americans are employed in the clean energy sector as of 2023.
-
The U.S. clean energy sector added over 300,000 new jobs from 2021 to 2022.
-
The traditional fossil fuel sector employs 1.2 million Americans.
-
The number of people employed in the traditional fossil fuel sector in 2023 has decreased by 10.4% since 2021.
-
As of 2023, renewable energy jobs constituted 2.2% of the U.S. workforce.
For further analysis, we have categorized the data as follows:
Job | Energy Type and Subsector | Trends and Projections
General Renewable Energy Job Creation Statistics
-
California leads the nation with 484,980 clean energy jobs as of 2023.
This represents 3.01% of the state’s workforce. California saw an increase of 2.2% in clean energy jobs from 2021 to 2023, indicating a rebound in employment within this sector.
-
Nevada has experienced a 38.9% increase in clean energy jobs from 2021 to 2023, the highest in the nation.
Nevada employed approximately 31,191 individuals in clean energy at the end of 2023, representing 2.49% of the state’s workforce.
Most of these jobs are in energy efficiency, with significant numbers in renewable energy, solar and wind, as well as energy storage. Here’s a breakdown:
-
10,656 energy efficiency jobs
-
9,870 renewable energy jobs
-
9,209 energy storage jobs
-
8,853 solar and wind jobs
-
-
Vermont has the highest percentage of clean energy jobs, accounting for 5.37% of its workforce.
This exceeds the national average of 2.2%. Vermont employs 15,236 workers in the clean energy sector, predominantly in energy efficiency (10,069 jobs).
Despite its high percentage, Vermont saw only a 0.8% increase in clean energy jobs from 2021 to 2023.
-
Since 2000, nearly 700 zero-energy buildings have been constructed in North America.
Construction of these buildings has surged, with a 42% increase from 2021 to 2023. These buildings produce as much renewable energy as they consume from traditional sources.
| State | % Of Job Growth (2021-2023) | Total Clean Energy Employment |
|---|---|---|
| Nevada | 38 | 31,191 |
| Louisiana | 11 | 26,393 |
| New Jersey | 10 | 50,096 |
| Oklahoma | 10 | 20,132 |
| West Virginia | 10 | 8,996 |
| Georgia | 9 | 71,111 |
| Florida | 9 | 149,624 |
| Pennsylvania | 9 | 87,313 |
| Colorado | 9 | 58,182 |
| Texas | 9 | 223,406 |
| State | % Share Of State Workforce | Total Clean Energy Employment |
|---|---|---|
| Vermont | 5 | 15,238 |
| Massachusetts | 3 | 108,909 |
| Maryland | 3 | 77,842 |
| Rhode Island | 3 | 13,874 |
| Wyoming | 3 | 8,042 |
| California | 3 | 484,980 |
| Oregon | 2 | 52,150 |
| Michigan | 2 | 113,456 |
| Delaware | 2 | 11,979 |
| Indiana | 2 | 80,614 |
Renewable Energy Job Statistics
-
Tesla, Inc. remains the largest renewable energy employer in the U.S., with 70,757 employees in 2021.
While Tesla is renowned for electric vehicles, it is also a leader in battery development and solar technology.
-
As of 2023, the median hourly wage for clean energy workers is approximately 25% higher than the national median.
The median wage in clean energy is $23.89 per hour, compared to $19.14 across all industries. Wind energy workers earn the highest median hourly wage at $25.95, while advanced biofuels workers earn the lowest at $19.55.
-
About 25% of U.S. counties identified as fossil fuel hubs also show significant potential for wind and solar energy production.
These counties, defined as having over 486 jobs in fossil fuels, represent the top 20% of U.S. counties in this sector, making them prime candidates for transitioning to renewable energy jobs.
Renewable Energy Job Creation Statistics By Energy Type and Subsector
-
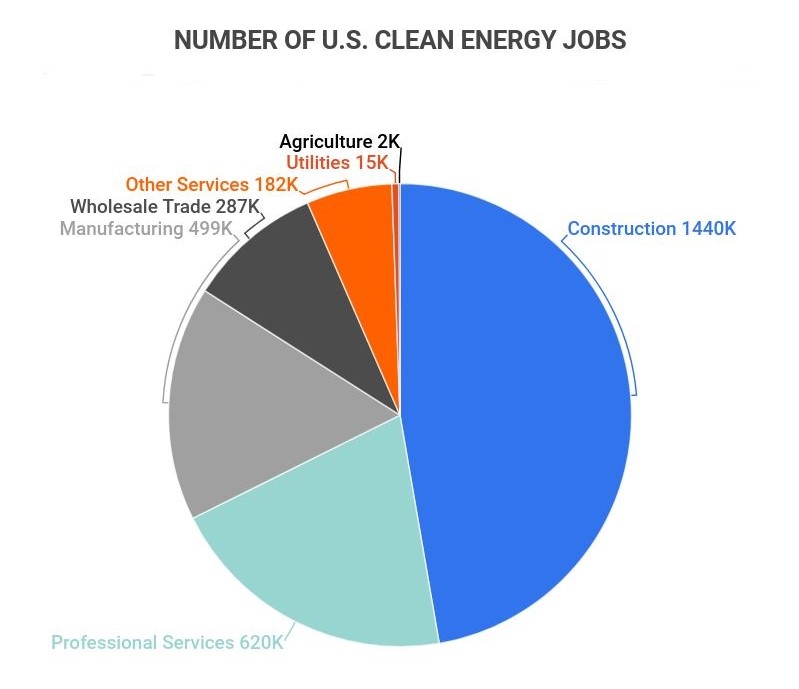
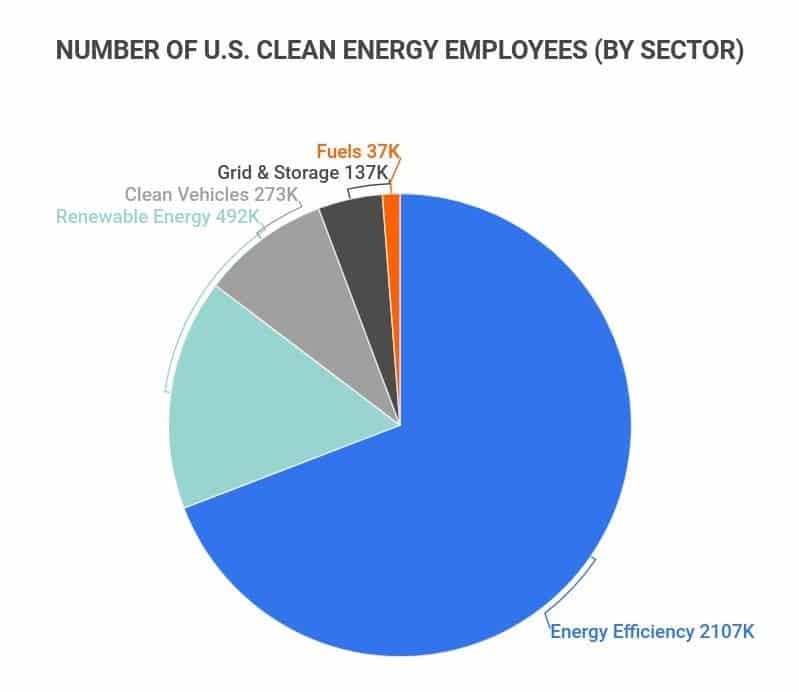
As of 2023, solar energy employs 316,675 people, the highest of any renewable energy source.
This accounts for approximately 10.6% of the clean energy workforce, followed by wind energy with 116,817 workers. Other sectors include geothermal energy (8,002 workers), bioenergy/CHP (40,146), and low-impact hydro (11,251).
-
Geothermal energy is the fastest-growing renewable energy subsector, with a job growth rate of 10.9% from 2017 to 2022.
Bioenergy/CHP follows with a 9.8% growth rate, while wind energy has grown by 6.8%. In contrast, solar energy jobs have seen a slight decline of 1.4% in that same timeframe.
-
The plug-in hybrid vehicle subsector has experienced a remarkable 28.1% increase in jobs from 2017 to 2022, the largest growth rate among clean energy subsectors.
As of 2023, this subsector employs 47,842 workers, with clean energy storage following at a 19.2% growth rate.
| Subsector | # Of Employees In 2023 |
|---|---|
| Trad. HVAC | 531,640 |
| High Efficiency HVAC | 498,863 |
| Energy STAR | 490,717 |
| Advanced Materials | 324,060 |
| Solar | 316,675 |
| Hybrid Electric Vehicles | 119,638 |
| Wind | 116,817 |
| Electric Vehicles | 83,733 |
| Clean Storage | 78,040 |
| Plug-In Hybrid Vehicles | 47,842 |
Renewable Energy Job Creation Trends and Projections
-
From 2015 to 2019, clean energy jobs grew 70% faster than the overall job growth rate in the U.S.
In 2019, the clean energy sector was adding jobs at a rate of 10.4%, compared to the overall economy’s 6.1% growth rate.
-
After a brief decline in 2020 due to the pandemic, clean energy jobs rebounded, achieving a growth rate of 10.7% from June to December 2020.
Before the pandemic, the projected growth rate for the industry was 5.3% for that year.
-
Wind turbine service technicians and solar photovoltaic installers are projected to be among the fastest-growing occupations over the next decade.
According to forecasts, these roles are expected to grow at rates of 60.7% and 50.5%, respectively, adding around 10,400 new jobs to the U.S. economy by 2029.
Renewable Energy Job Creation FAQ
-
How many jobs are available in energy?
In the U.S., there are 7.8 million jobs available in the energy sector. This reflects significant growth from 2021 to 2022, rising from 7.5 million to 7.8 million (a 4% increase).
-
Which renewable energy source is creating the most jobs?
Geothermal energy is leading in job creation. It saw a 10.9% increase in employment from 2017 to 2022.
-
What are examples of jobs in renewable energy?
Renewable energy encompasses a variety of jobs in sectors including wind, solar, hydro, and electric power. Examples include wind turbine technicians, fuel cell chemists, and home weatherization technicians.
-
Do renewables create jobs?
Yes, renewables generate jobs. The renewable energy sector has added approximately 95,000 jobs annually from 2017 to 2019.
-
How fast are renewable energy jobs growing?
From 2015 to 2019, renewable energy jobs grew 70% faster than the total nationwide job growth rate. In the latter half of 2020, renewable energy jobs experienced a growth rate of 10.7%.
-
Is renewable energy a good career?
Yes, renewable energy offers a promising career with ample opportunities. The sector is expanding rapidly, with a high demand for qualified professionals.
Global support from governments for renewable energy initiatives suggests a positive long-term outlook for careers in this field.
-
Which energy source creates the most jobs per unit of energy produced?
Photovoltaic solar (PV) generates the most jobs per unit of energy produced. This technology converts sunlight directly into electricity.
Conclusion
The clean energy industry is rapidly evolving, with no signs of slowing down. Despite previous challenges, the sector has rebounded and is projected to continue growing significantly.
Current job growth projections indicate that wind and solar energy jobs will expand at rates of 60.7% and 50.5%, respectively, far surpassing the overall rate of 3.7% for all occupations in the coming years.
References
-
E2. “Clean Jobs America 2021.” Accessed on September 22, 2021.
-
New Buildings Institute. “Zero Energy-Verified Commercial Buildings More Than Double Since 2018.” Accessed on September 22, 2021.
-
Green Citizen. “10 Largest Renewable Energy Stocks To Add to Your Portfolio in 2021.” Accessed on September 22, 2021.
-
E2. “Clean Jobs, Better Jobs.” Accessed on September 22, 2021.
-
Brookings. “How Renewable Energy Jobs Can Uplift Fossil Fuel Communities and Remake Climate Politics.” Accessed on September 22, 2021.
-
Clean Choice Energy. “Renewable Energy Jobs for Fossil Fuel Workers.” Accessed on September 22, 2021.
-
E2. “Clean Jobs America 2020.” Accessed on September 22, 2021.
-
U.S. Bureau of Labor Statistics. “Solar and Wind Generation Occupations: A Look at the Next Decade.” Accessed on September 22, 2021.
-
Office of Energy Efficiency and Renewable Energy. “Explore Clean Energy Careers.” Accessed on September 22, 2021.
- Tech Industry Statistics
- MFA Statistics
- Streaming Services Statistics
- Mobile Vs. Desktop Usage Statistics
- AI Statistics
- Live Streaming Statistics
- Zoom Meeting Statistics
- Cord Cutting Statistics
- Digital Transformation Statistics
- Virtual Reality Statistics
- How Fast Is Technology Advancing
- Mobile Commerce Statistics
- SaaS Statistics
- Machine Learning Statistics
- Diversity In High Tech
- Cyber Security Statistics
- Ecommerce Statistics
- Tech Industry
- Gaming Industry
- Renewable Energy Job Creation
- Smartphone Industry
- Cybercrime Statistics
- Amazon Statistics
- Personalization Statistics
Author
Chris Kolmar is a co-founder of Zippia and the editor-in-chief of the Zippia career advice blog. He has hired over 50 people in his career, been hired five times, and wants to help you land your next job. His research has been featured on the New York Times, Thrillist, VOX, The Atlantic, and a host of local news. More recently, he's been quoted on USA Today, BusinessInsider, and CNBC.