- Industry Statistics
- Wedding Industry Statistics
- Yoga Industry Statistics
- Music Industry Statistics
- Landscaping Industry Statistics
- Bicycle Industry Statistics
- Coffee Industry Statistics
- Car Rental Industry Statistics
- Home Improvement Industry Statistics
- Insurance Industry Statistics
- Supplements Industry Statistics
- Golf Industry Statistics
- Fitness Industry Statistics
- US Media And Entertainment Industry Statistics
- Firearm Industry Statistics
- Financial Services Industry Statistics
- Health And Wellness Industry Statistics
- Trucking Industry Statistics
- Wine Industry Statistics
- Pet Industry Statistics
- Mobile App Industry Statistics
- Digital Marketing Industry Statistics
- Hotel Industry Statistics
- Retail Statistics
- Robotics Industry Statistics
- Jewelry Industry Statistics
- Appointment Scheduling statistics
- Restaurant Industry Statistics
- Food Delivery Statistics
- Food Truck Industry
- Fashion Industry
- Real Estate Industry
- US Film Industry
- US Beverage Industry
- USu202fFast Food Restaurants
- US Construction Industry
- US Book Industry
- Cosmetics Industry
- US Food Retail Industry
- US Pharmaceutical Industry
- US Healthcare Industry
- Airline Industry
- Automobile Industry
- Transportation Industry Statistics
- Event Industry Statistics
- Project Management Statistics
- Oil And Gas Industry Statistics
- Nursing Home Statistics
- Nursing Shortage Statistics
- Nursing Statistics
45+ Must-Know US Restaurant Industry Statistics [2026]: How Many Restaurants Are In The US
Restaurant industry research summary. The US restaurant industry attracts millions of patrons yearly, demonstrating that dining out remains a cherished experience for many Americans. However, the sector is evolving rapidly, driven by advancements in restaurant technology, online ordering, and changing consumer preferences. Below are crucial statistics that highlight the current state of the ever-changing restaurant industry:
-
As of 2026, there are approximately 749,404 restaurants operating in the United States.
-
It is projected that the number of restaurant employees will reach 15.5 million by the end of this year.
-
90% of restaurants in the US are small businesses with fewer than 50 employees.
-
70% of restaurants in the United States operate as single-unit establishments.
-
94% of diners check online reviews before choosing a restaurant.
-
The US restaurant industry generated $997 billion in sales in 2023, marking significant growth from previous years.
-
During the pandemic, around 110,000 restaurant locations temporarily or permanently closed in 2020.
-
In 2020, restaurant industry sales fell short of pre-pandemic forecasts by $240 billion.
For further insights, we have categorized the data into the following sections:
The Effects of the Pandemic | Restaurant Consumers | Customer Reviews | Employment | Restaurant Owners | Restaurant Technology | Online Ordering
General Restaurant Industry Statistics
The restaurant industry is a major contributor to the US economy, but it has experienced considerable fluctuations. Here are some key statistics that provide insight into the current landscape:
-
Restaurants contribute approximately 4% of the United States GDP.
-
As of 2023, there are 103,323 chain restaurants in the United States.
-
In 2019, there were 490,000 independent restaurants in the US.
-
The sales forecast for the restaurant industry in 2023 stands at $997 billion.
-
90% of restaurants in the United States employ fewer than 50 staff members.
-
The average profit margin for a full-service restaurant is 3 to 5%, while fast-casual restaurants average 6 to 9%, and catering services range from 7 to 8%.
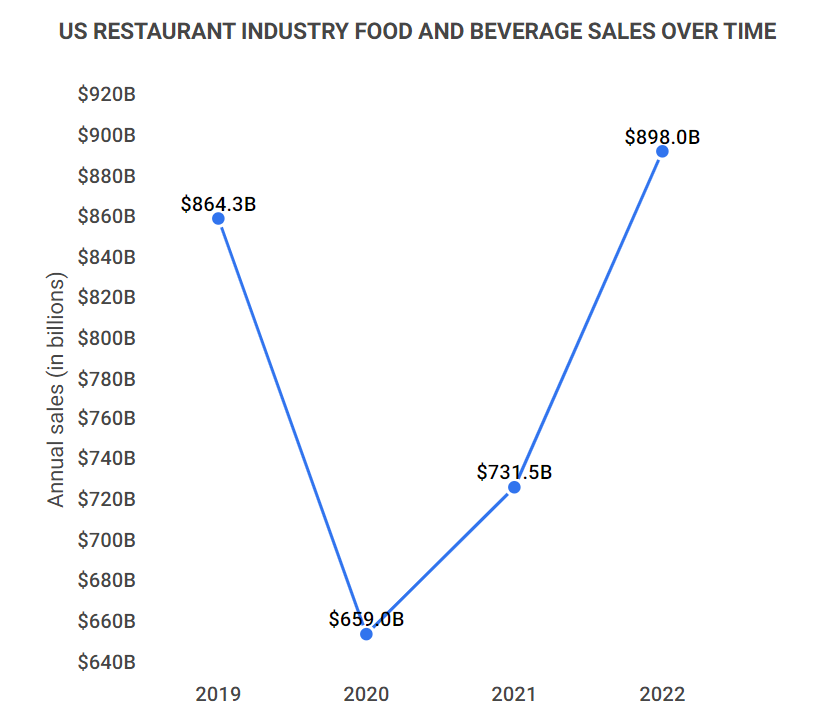
Restaurant Industry Sales 2019-2021
| Segment | 2019 Sales | 2020 Sales | 2021 Sales |
|---|---|---|---|
| Full-service segment | $285B | $199.5B | $220.8B |
| Limited service segment | $308.9B | $290.4B | $313.6B |
| Bars and taverns | $22B | $7.7B | $13.9B |
| All other foodservice establishments | $248.4B | $161.5B | $183.2B |
| Total | $864.3B | $659B | $731.5B |
Restaurant Industry Statistics and the Pandemic
The COVID-19 pandemic had a profound impact on the restaurant industry. Countless establishments faced closure, and many employees lost their jobs. Here are some findings that illustrate the pandemic’s effects on the industry:
-
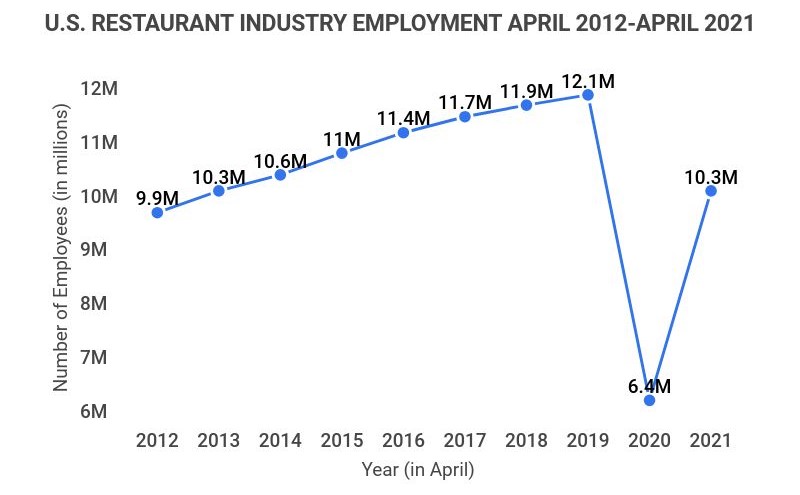
2.4 million restaurant employees lost their jobs during the pandemic.
During the 2020 holiday season, 372,000 restaurant and bar workers were laid off, accounting for 74% of unemployment figures in December 2020.
-
Restaurant sales dropped by $205.3 billion in 2020.
This marked a significant decline of 23.8% from the previous year.
-
10% of all restaurants in the United States have permanently closed since the pandemic began.
Initially, there were 778,807 food establishments operating in the US; since then, 79,438 have shut down permanently.
Restaurant Industry Statistics by Consumers
Consumer preferences significantly influence the restaurant industry. For example, as demand for breakfast options and convenient takeout increases, restaurants adapt accordingly. Here’s how consumer behavior impacts the sector:
-
51% of Americans now use delivery services to order meals from restaurants.
Among these, 26% report ordering takeout or delivery at least once a week.
-
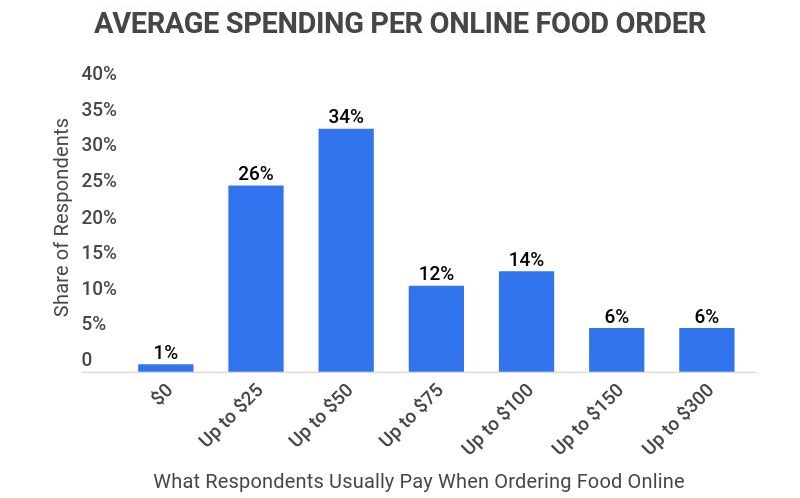
34% of consumers spend an average of $50 when ordering food online.
In contrast, 26% typically spend up to $25, while 14% spend over $100 per order.
-
56% of Americans report dining out at least 2 to 3 times per week.
Additionally, 10% eat out 4 to 6 times weekly, and 6% do so daily.
-
Those earning between $40,000 to $50,000 annually spend the most on dining out.
This group spends an average of $117.82 weekly, accounting for 12.25 to 15.31% of their income.
-
The average American spends about $2,994 yearly on food away from home.
This figure reflects a decrease of 12.8% compared to previous years.
-
77% of consumers visit a restaurant’s website before dining in or ordering takeaway.
Furthermore, 30% of diners are discouraged by a difficult-to-read menu, and another 30% dislike outdated websites.

Restaurant Statistics by Customer Reviews
Consumer reviews play a critical role in the success of restaurants. Patrons often rate their dining experiences, which significantly influences future customers. Here are some insights into the importance of reviews:
-
90% of diners research restaurants online before visiting.
Consumers place a high value on their dining experiences, making the restaurant industry particularly review-sensitive.
-
33% of diners will not eat at a restaurant with less than four stars.
This underscores the importance of maintaining high ratings, as 92% of diners consult reviews before making dining decisions.
-
77% of consumers prefer reading reviews from other diners over professional critics.
Many patrons are more influenced by the opinions of fellow diners than by critics.
-
45% of diners have tried a restaurant for the first time due to a social media post.
Conversely, 13% have decided against returning because of poor social media engagement.
-
Approximately 5 to 10% of consumers write reviews.
While this may seem small, 84% of people trust these online reviews as much as personal recommendations.
Restaurant Statistics by Employees
The restaurant industry relies heavily on its workforce, from large franchises to local establishments. Here are key statistics about restaurant employees:
-
7.1% of the US workforce is employed in the restaurant industry.
-
In a survey, 50% of restaurant employees indicated that more training would improve their job satisfaction, with 70% of those seeking hands-on training from a manager.
-
54.5% of restaurant workers are women, while 45.5% are men.
-
The average age of a restaurant worker is 27 years.
-
The typical annual salary for a restaurant employee is $25,504.
-
90% of restaurant managers began their careers in entry-level positions.
Median Hourly Wage for Foodservice Workers
| Occupation | Median Hourly Wage |
|---|---|
| Foodservers, nonrestaurant | $12.46 |
| Dining room and cafeteria attendants and bartender helpers | $12.03 |
| Hosts and Hostesses, restaurant, lounge, and coffee shop | $11.48 |
| Fast food and counter workers | $11.47 |
Restaurant Industry Statistics by Owners
Restaurant ownership can vary widely, from CEOs of large franchises to sole proprietors of small eateries. Regardless of size, restaurant owners face unique challenges:
-
The primary challenge for restaurant owners is recruiting and retaining quality staff.
Post-pandemic, sourcing and maintaining a competent workforce is crucial. Other significant challenges include rising food costs, operational expenses, and customer acquisition.
-
The average cost to replace a single frontline restaurant employee is approximately $5,864, according to the Center for Hospitality Research at Cornell.
This figure breaks down into 20% for recruiting, 14% for training and orientation, and 52% attributed to productivity loss.
-
A one-star increase on Yelp can lead to a 5% to 9% boost in revenue.
This impact is particularly pronounced for independent restaurants, while chain establishments are less affected.

Restaurant Industry Statistics by Technology
Technological advancements are reshaping food service, with digital ordering and automation becoming essential components of modern operations:
-
75% of restaurants are expected to implement contactless ordering and payment options, with 61% already accepting contactless payments.
-
As of 2021, 91% of restaurants have adopted kitchen automation technology.
-
Digital food ordering has surged by 135% since June 2020.
-
81% of diners have utilized a restaurant’s website to place orders online.
-
According to research, 65% of customers would visit a restaurant more frequently if self-service kiosks were available.
-
79% of consumers believe that technology enhances their dining experience.
Restaurant Statistics by Online Ordering
The pandemic catalyzed several trends in the restaurant industry, one of which is the rise of online ordering. Here are compelling statistics that illustrate this trend:
-
Online food ordering is projected to exceed $220 billion by 2025.
This figure represents approximately 40% of total restaurant sales.
-
46% of consumers expect restaurants to offer online ordering.
When ordering online, about 67% of diners prefer using a restaurant’s website or app for delivery.
-
Online ordering constitutes roughly 42% of the total food ordering market.
While the broader food industry grows at a steady rate of 3.7%, online ordering has demonstrated an annual growth rate of 15% to 20%.
Restaurant Industry Statistics FAQ
-
Is the restaurant industry growing or shrinking?
The restaurant industry is gradually recovering after the challenges posed by the COVID-19 pandemic. While the sector faced significant setbacks, including a 24% drop in sales and the permanent closure of 10% of establishments, advancements in technology and online ordering have spurred growth in new areas.
-
What is the restaurant industry forecast for 2022?
The restaurant industry is expected to see continued growth in technology and digital ordering. As consumer preferences shift, restaurants are prioritizing tech solutions to enhance the dining experience.
-
What percentage of the United States economy is accounted for by the restaurant industry?
The restaurant industry accounts for 4% of the United States economy.
-
How many people have left the restaurant industry since 2020?
2.4 million restaurant employees have left the industry since the pandemic began.
Conclusion
The restaurant industry is a cornerstone of the US economy, employing approximately 15.5 million people and generating nearly $997 billion in sales annually.
Representing 4% of the US GDP, the restaurant sector surpasses industries like automotive and fashion in economic contribution.
Dining out has long been a staple of American culture, with many people enjoying meals in restaurants multiple times a week.
Despite facing unprecedented challenges from the COVID-19 pandemic, the industry has shown resilience and adaptability. The shift towards online ordering, social media engagement, and contactless services reflects a new era for restaurants.
With online ordering projected to reach $220 billion by 2025, the restaurant industry is poised for growth, although it will require continued innovation and adaptation to meet changing consumer demands.
References
-
National Restaurant Association. “Restaurant Industry Facts at a Glance.” Accessed on March 6, 2023
-
BLS. “Food Services and Drinking Places: NAICS 722.” Accessed on March 6, 2023
-
Forbes. “Restaurant Industry Outlook For 2022: Five Trends To Watch.” Accessed on March 6, 2023
-
Hospitality Technology. “79% of Diners Say Technology Improves Their Restaurant Experience.” Accessed on March 6, 2023
- Industry Statistics
- Wedding Industry Statistics
- Yoga Industry Statistics
- Music Industry Statistics
- Landscaping Industry Statistics
- Bicycle Industry Statistics
- Coffee Industry Statistics
- Car Rental Industry Statistics
- Home Improvement Industry Statistics
- Insurance Industry Statistics
- Supplements Industry Statistics
- Golf Industry Statistics
- Fitness Industry Statistics
- US Media And Entertainment Industry Statistics
- Firearm Industry Statistics
- Financial Services Industry Statistics
- Health And Wellness Industry Statistics
- Trucking Industry Statistics
- Wine Industry Statistics
- Pet Industry Statistics
- Mobile App Industry Statistics
- Digital Marketing Industry Statistics
- Hotel Industry Statistics
- Retail Statistics
- Robotics Industry Statistics
- Jewelry Industry Statistics
- Appointment Scheduling statistics
- Restaurant Industry Statistics
- Food Delivery Statistics
- Food Truck Industry
- Fashion Industry
- Real Estate Industry
- US Film Industry
- US Beverage Industry
- USu202fFast Food Restaurants
- US Construction Industry
- US Book Industry
- Cosmetics Industry
- US Food Retail Industry
- US Pharmaceutical Industry
- US Healthcare Industry
- Airline Industry
- Automobile Industry
- Transportation Industry Statistics
- Event Industry Statistics
- Project Management Statistics
- Oil And Gas Industry Statistics
- Nursing Home Statistics
- Nursing Shortage Statistics
- Nursing Statistics
Author
Sky Ariella is a professional freelance writer, originally from New York. She has been featured on websites and online magazines covering topics in career, travel, and lifestyle. She received her BA in psychology from Hunter College.