- Business Statistics
- Startup Statistics
- Cloud Adoption Statistics
- Customer Loyalty Statistics
- Nonprofit Statistics
- Affiliate Marketing Statistics
- Cart Abandonment Rate Statistics
- Ridesharing Statistics
- Call Center Statistics
- eLearning statistics
- Customer Service Statistics
- Customer Experience statistics
- Entrepreneur Statistics
- Outsourcing Statistics
- Gross Revenue for Marketing and Advertising
- Sales Statistics
- MBA Statistics
- Average Small Business Revenue + Profit Margin
- How Much Do Employee Benefits Cost?
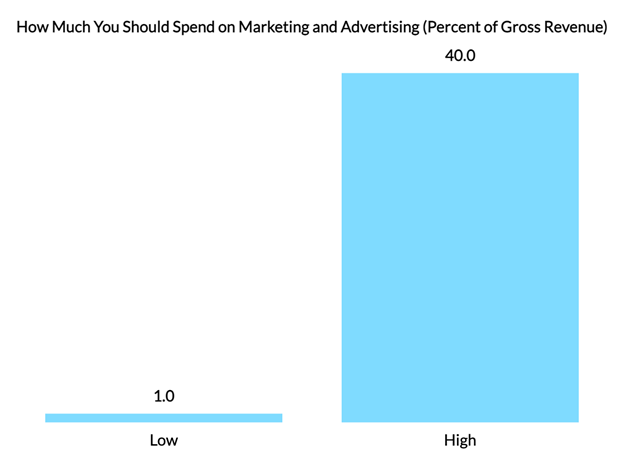
Research Summary. In 2026, companies typically allocate between 1% and 40% of their gross revenue for marketing and advertising. This percentage varies widely based on multiple factors, including the nature of the product or service, the competitive landscape, profit margins, and the company’s stage in its business lifecycle.
Based on comprehensive research, our data analysis team has established the following insights:
-
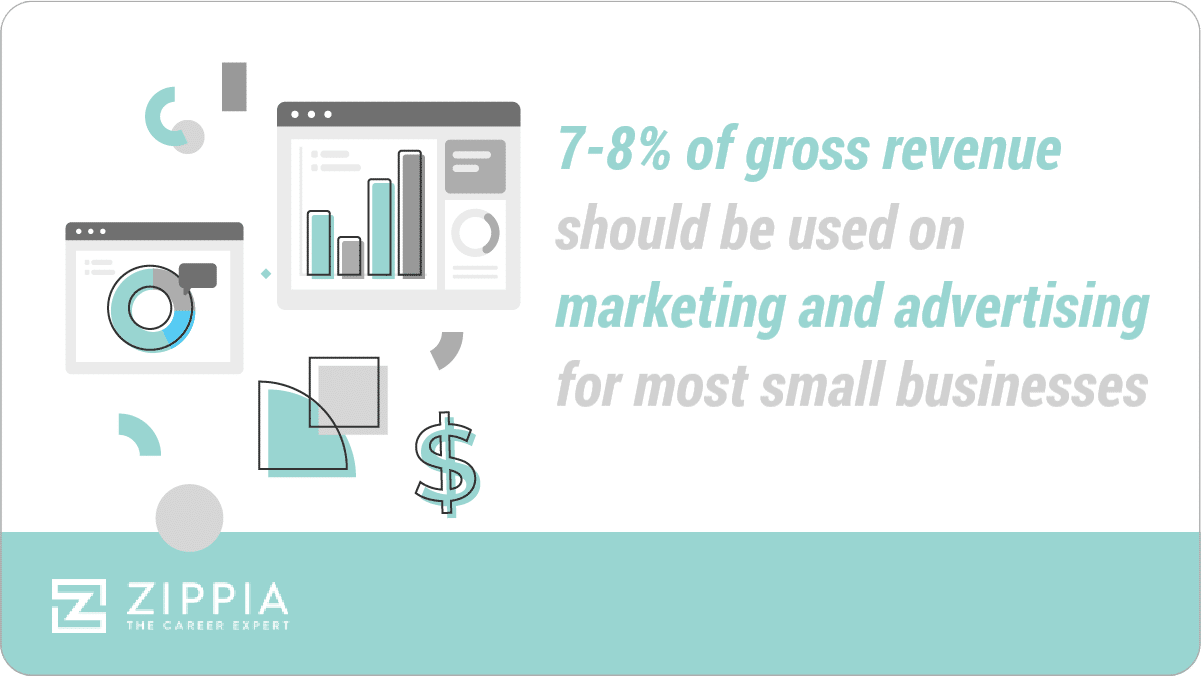
A guideline is to invest between 7% and 8% of gross revenue on marketing and advertising, although this figure can rise to 40% under specific circumstances.
-
Marketing budgets as a percentage of revenue peaked in June 2020, primarily influenced by shifts in consumer behavior.
-
Although there was a 3.9% decline in marketing expenditure in the previous year, current trends indicate a strong rebound and continued growth in marketing budgets.
-
Digital advertising, including social media, online video, and email marketing, has surpassed traditional marketing methods like TV and print, a trend expected to strengthen.
-
To craft a marketing budget, thorough industry research, establishing clear goals, and diligent cost tracking are essential.
For more detailed insights, we have categorized the data as follows:
Company Size and Industry | Trends and Projections
General Statistics on What Percentage of Revenue Should Be Spent on Marketing
-
Spending should range between 1% and 40% of gross revenue on marketing and advertising, depending on various critical factors.
If your business generates less than $5 million in annual sales and has a profit margin of 10% to 12%, the U.S. Small Business Administration recommends allocating 7% to 8% of gross revenue for marketing and advertising.
Research involving over 160 Chief Marketing Officers shows that companies typically spend a mean of 8% and a median of 5% on marketing. In contrast, marketing and advertising account for a median of 10% of overall budgets, with a mean average of 12%.
Determining a general budget recommendation is complex, as companies may define their marketing budget differently. For instance, one company might include sales expenses in their marketing budget while another might separate them.
Factors affecting recommended spending can include:
-
Nature of the product or service (new vs. established, price point);
-
Competitive landscape;
-
Target market dynamics;
-
Goals and performance metrics;
-
Available budget;
-
Geographic location;
-
Business longevity;
-
Current business phase (e.g., startup vs. nearing closure).
-
-
Your marketing budget includes all costs related to marketing, advertising, public relations, and promotions.
Common expenses include Google Ads, social media campaigns, print ads, sponsorships, events, promotional materials, and sampling.
Leaders should ensure they account for all aspects when establishing their marketing budget.
-
To create a marketing budget, research, goal-setting, and cost tracking are essential.
Consider these tips when developing your marketing budget:
-
Research your industry — What are typical spending levels? How do your competitors compare? How does your company size align?
-
Set specific goals — Clearly defined, measurable objectives can help shape your marketing strategy tailored to your target audience. Examples might include increasing web traffic, generating leads, or expanding market share.
-
Account for all potential costs — Marketing encompasses various components, each with associated costs, including websites, social media, online ads, newsletters, and videos.
-
Monitor your expenses — Regularly review your budget and assess progress to identify which marketing strategies yield the best results, allowing for timely adjustments.
-
-
Email and social media marketing typically provide the highest returns on investment (ROI).
Here’s a breakdown of ROI for various marketing channels:
Marketing Channel ROI
Type Very Poor Poor Average Good Excellent Social media marketing 7% 12% 30% 33% 17% Search engine optimization (SEO) 8% 12% 35% 31% 14% Email marketing 6% 11% 30% 35% 18% Display advertising 13% 20% 38% 20% 8% Direct mail 15% 18% 34% 23% 10% Content marketing 8% 12% 38% 32% 11% Affiliate marketing 12% 17% 39% 24% 9% Social PPC 8% 15% 35% 30% 12% Search engine/PPC advertising 10% 17% 38% 25% 9% -
Recent surveys indicate that 58% of chief marketing officers spent less than 4% of gross revenue on marketing.
16% allocated between 5% and 6%, while 23% spent more than 6%, and only 2% exceeded 20%. Overall, 74% of respondents reported expenditures between 0% and 6%.
-
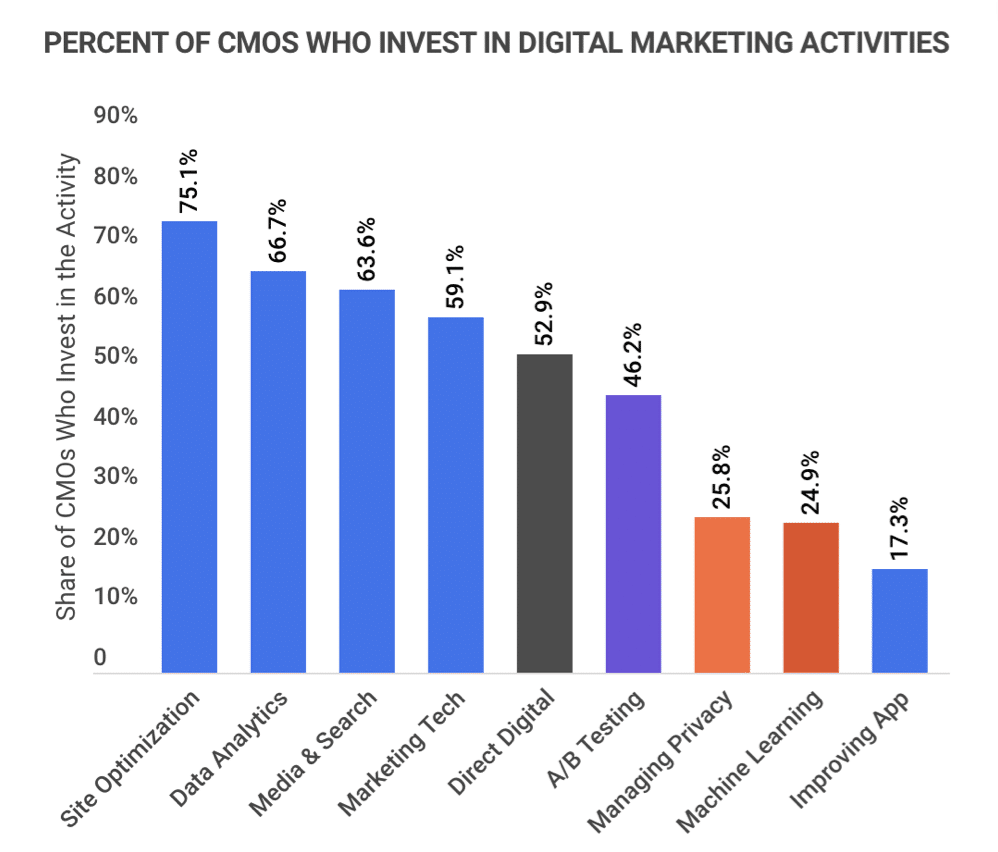
Most CMOs are investing in website optimization (75.1%) and data analytics (66.7%) to enhance their digital marketing performance.
Other significant investment areas include:
-
Digital media and search: 63.6%
-
Marketing technology systems/platforms: 59.1%
-
Direct digital marketing: 52.9%
-
Online experimentation and A/B testing: 46.2%
-
Managing privacy issues: 25.8%
-
Machine learning and automation: 24.9%
-
Enhancing apps: 17.3%
-
Marketing Spend as a Percentage of Revenue by Company Size and Industry
-
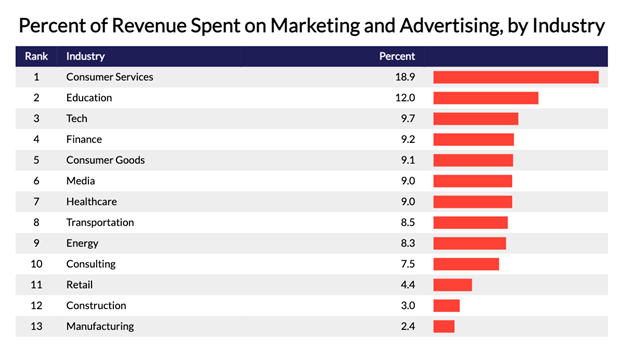
Companies in the consumer services (18.9%) and education (12%) sectors allocate more of their revenue to marketing than others.
Here’s a breakdown of marketing spending by industry:
-
Tech: 9.7%
-
Banking/finance/insurance: 9.2%
-
Communications/media: 9.0%
-
Consumer packaged goods: 9.1%
-
Energy: 8.3%
-
Healthcare: 9.0%
-
Manufacturing: 2.4%
-
Mining/construction: 3.0%
-
Service consulting: 7.5%
-
Retail/wholesale: 4.4%
-
Transportation: 8.5%
Looking ahead, the Pharma/Biotech sector anticipates the largest growth in traditional marketing (10.0%), while Mining/Construction forecasts the most significant decline (-8.2%).
-
-
B2C companies that sell products generally invest more in marketing than B2B companies.
Here’s the comparison:
Percent of Revenue for Marketing By Type of Company
Economic Sector Marketing Budget as Percent of Firm Budget Marketing Spending as Percent of Company Revenue B2B Product 10.4% 9.0% B2B Service 9.9% 7.9% B2C Product 20.0% 11.9% B2C Service 8.2% 4.8% -
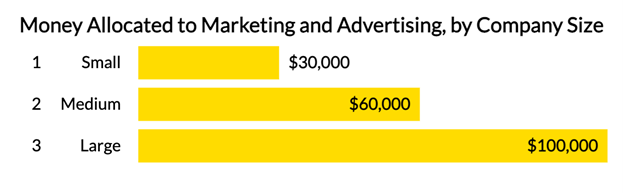
As company size increases, so does marketing expenditure.
Small businesses average around $30,000 annually on marketing, which rises to $60,000 for companies with 20-49 employees and over $100,000 for those with 50 or more employees.
Marketing as a Percentage of Revenue Trends and Projections
-
Since 2011, marketing budgets as a percentage of revenue have generally risen, reaching a peak of 12.6% in June 2020.
Here’s the historical trend:
Marketing Budgets as a Percentage of Firm Revenue By Year
Month/Year Percentage February 2021 11.7% June 2020 12.6% February 2020 11.3% February 2018 11.1% February 2017 11.1% February 2016 12.1% February 2015 10.1% February 2014 10.9% February 2013 10.6% February 2012 10.4% February 2011 8.10% -
The economic landscape has influenced marketing budgets significantly.
For instance, the shifts in marketing budgets due to market conditions since 2020 have varied by industry:
Market-Related Marketing Budget Changes by Industry
Industry Percent Lost/Gained Banking -7.9% Communications/Media 14.7% Education 6.7% Energy -10.0% Healthcare/Pharma 3.0% Manufacturing 4.1% Mining/Construction -18.3% Services Consulting 15.9% Technology 8.0% Transportation -1.7% -
Despite a 3.9% reduction in overall marketing spending last year, marketers anticipate an 11.5% increase this year, which is expected to continue.
Digital budgets are projected to grow by 10.1%, while traditional advertising may see a slight decline (-0.2%). Most marketers are prioritizing customer retention and brand value over merely improving marketing ROI.
-
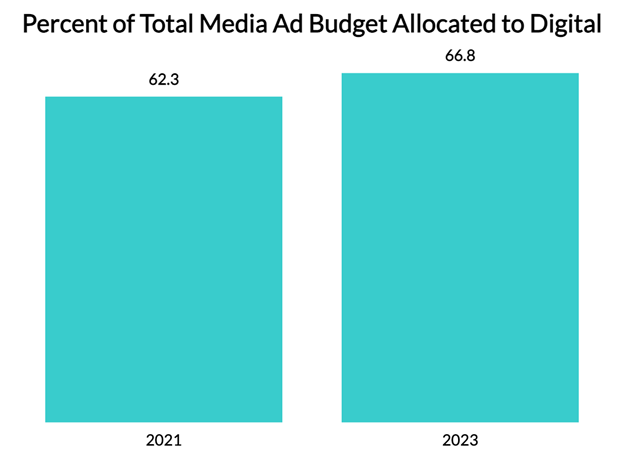
In 2021, companies planned to allocate 62.3% of their total media ad budget to digital advertising.
This figure is expected to rise to 66.8% by 2023, with search engine marketing expected to dominate the digital landscape, followed by online display advertising and investments in social media and email marketing.
Together, these channels are anticipated to make up 46% of all advertising budgets.
-
Digital advertising continues to grow, while traditional advertising is on the decline.
As traditional advertising investments have decreased annually, digital marketing expenditures have experienced consistent double-digit growth.
Digital Ad Spending in the U.S., 2018-2023
Year Digital Ad Spending (billions) % of Total Media Ad Spending 2023 $201.83 66.8% 2022 $187.77 64.8% 2021 $172.29 62.3% 2020 $151.29 58.5% 2019 $129.34 54.2% 2018 $108.64 48.6% -
On average, marketers allocate over 10% of their budgets to social media advertising.
In 2021, 93% of marketers invested in Facebook, up from 91% in 2019. Instagram and LinkedIn showed similar growth, with usage increasing from 69% to 78% and 45% to 61%, respectively.
Here’s a detailed breakdown of social media investments:
Social Media Investment by Platform
Platform Participation Facebook 93% Instagram 78% LinkedIn 61% YouTube 55% Twitter 48% TikTok 9% Reddit 14% Snapchat 4%
Gross Revenue for Marketing FAQ
-
What percentage of gross revenue should companies use for marketing and advertising?
You should spend between 1% and 40% of gross revenue on marketing and advertising. This allocation depends on various factors, including your product or service, competition, target market, location, business longevity, and budgetary constraints.
-
How can you develop a marketing budget for your business?
Research and goal-setting are critical when developing a marketing budget. This includes analyzing your industry (and competitors), establishing clear, measurable goals, and considering all potential costs, particularly for online advertising and social media.
-
What are some of the top digital channels to use when marketing your products or services?
Key channels include search engine marketing, online display, video advertising, and email marketing. As digital advertising continues to dominate, these channels offer effective avenues for attracting customers.
-
What percentage of revenue comes from advertising?
In the U.S., 60-80% of all revenue is derived from advertising. Companies typically invest 7-8% of their revenue in advertising, translating to an average ROI of $2 for every dollar spent. Advertising plays a vital role in reaching new customers and educating them about product offerings.
-
How much money do social media companies make from advertising?
Globally, social media companies generated $153 billion in advertising revenue in 2021. This figure is projected to increase to $252 billion by 2026, as advertising remains the primary revenue stream for these platforms.
Even though services like YouTube are free for users, the companies profit from the ads displayed during video content, as advertisers pay for exposure to a large audience.
Conclusion
In 2026, while some businesses allocate as much as 40% of their gross revenue on marketing and advertising, the majority typically invest between 5% and 8%. This varies by factors such as industry, competition, target market, and financial capability.
Regardless of your budget, digital advertising remains the future of marketing. It’s crucial to remember that ROI can differ significantly across channels, so conducting thorough research before allocating funds is essential for maximizing your marketing effectiveness.
Sources
-
Ven:Dux. The Start-up Dilemma – How Much to Spend on Sales & Marketing. Accessed on 9/20/21.
-
Chron.com. What Percentage of Gross Revenue Should Be Used for Marketing & Advertising? Accessed on 9/20/21.
-
Business Development Bank of Canada (BDC). What is the average marketing budget for a small business? Accessed on 9/20/21.
-
Nuphoric. How Much Should You Be Spending on Marketing? Accessed on 9/20/21.
-
121mcv Sales and Marketing. What Percentage of Gross Revenue Should Be Used for Marketing & Advertising? Accessed on 9/20/21.
-
Gartner. Insights From Gartner’s CMO Spend Survey, 2021. Accessed on 9/20/21.
-
Deloitte. The CMO Survey: The transformation of marketing. Accessed on 9/20/21.
-
Entrepreneur. Calculating Your Ad Budget. Accessed on 9/20/21.
-
WebStrategies, Inc. How Much Should You Budget For Marketing In 2023? Accessed on 4/3/23.
-
That Agency. 2020 B2B Marketing Spend by Industry. Accessed on 9/21/21.
-
Deloitte. The CMO Survey: Marketing in a Post-Covid Era. Accessed on 4/3/23.
- Business Statistics
- Startup Statistics
- Cloud Adoption Statistics
- Customer Loyalty Statistics
- Nonprofit Statistics
- Affiliate Marketing Statistics
- Cart Abandonment Rate Statistics
- Ridesharing Statistics
- Call Center Statistics
- eLearning statistics
- Customer Service Statistics
- Customer Experience statistics
- Entrepreneur Statistics
- Outsourcing Statistics
- Gross Revenue for Marketing and Advertising
- Sales Statistics
- MBA Statistics
- Average Small Business Revenue + Profit Margin
- How Much Do Employee Benefits Cost?
Author
Chris Kolmar is a co-founder of Zippia and the editor-in-chief of the Zippia career advice blog. He has hired over 50 people in his career, been hired five times, and wants to help you land your next job. His research has been featured on the New York Times, Thrillist, VOX, The Atlantic, and a host of local news. More recently, he's been quoted on USA Today, BusinessInsider, and CNBC.