- Industry Statistics
- Wedding Industry Statistics
- Yoga Industry Statistics
- Music Industry Statistics
- Landscaping Industry Statistics
- Bicycle Industry Statistics
- Coffee Industry Statistics
- Car Rental Industry Statistics
- Home Improvement Industry Statistics
- Insurance Industry Statistics
- Supplements Industry Statistics
- Golf Industry Statistics
- Fitness Industry Statistics
- US Media And Entertainment Industry Statistics
- Firearm Industry Statistics
- Financial Services Industry Statistics
- Health And Wellness Industry Statistics
- Trucking Industry Statistics
- Wine Industry Statistics
- Pet Industry Statistics
- Mobile App Industry Statistics
- Digital Marketing Industry Statistics
- Hotel Industry Statistics
- Retail Statistics
- Robotics Industry Statistics
- Jewelry Industry Statistics
- Appointment Scheduling statistics
- Restaurant Industry Statistics
- Food Delivery Statistics
- Food Truck Industry
- Fashion Industry
- Real Estate Industry
- US Film Industry
- US Beverage Industry
- USu202fFast Food Restaurants
- US Construction Industry
- US Book Industry
- Cosmetics Industry
- US Food Retail Industry
- US Pharmaceutical Industry
- US Healthcare Industry
- Airline Industry
- Automobile Industry
- Transportation Industry Statistics
- Event Industry Statistics
- Project Management Statistics
- Oil And Gas Industry Statistics
- Nursing Home Statistics
- Nursing Shortage Statistics
- Nursing Statistics
Research Summary. Wine continues to be an integral part of daily life for many around the globe, reflecting a rich cultural heritage. Here are the latest key statistics regarding the wine industry:
-
The retail value of wine sales in the U.S. is $79.1 billion.
-
As of 2022, there were 773 million gallons of wine produced in the U.S.
-
Approximately 81% of U.S. wine was produced in California in 2022.
-
There are over 7,475 wine businesses in the U.S. as of 2023.
-
The U.S. wine and brandy market generated $29.2 billion in revenue in 2018.
-
The global wine industry experienced a CAGR of 5.3% from 2015 to 2019.
For further analysis, we broke down the data in the following ways:
U.S. | Global | Trends and Projections | Wines
General Wine Industry Statistics
-
In 2022, 24.85 billion liters of wine were sold worldwide.
This sales volume was lower than the 27.47 billion liters sold in 2019 but is projected to increase, with sales expected to reach 26.59 billion liters in 2023.
-
The average wine consumption per U.S. resident in 2021 was 3.09 gallons.
This figure reflects a steady increase from 2.91 gallons in 2019, with overall consumption rising by 33% since 2005.
-
Worldwide wine consumption in 2022 was approximately 236 million hectoliters.
The U.S. remained the largest consumer, drinking 33 million hectoliters, followed closely by France at 24.7 million hectoliters.
U.S. Wine Industry Statistics
-
The top five states for wine production are California, Washington, New York, Oregon, and Texas.
Here is the breakdown of wine production and the number of wineries in each state:
State Gallons of Wine Produced Number of Wineries California 684.9 million 4,501 Washington 35.7 million 792 New York 28.5 million 403 Oregon 10.9 million 793 Texas 4.3 million 352 -
12% of the world’s wine is produced in the U.S.
California alone accounts for about 85% of U.S. wine production and 95% of U.S. wine exports.
-
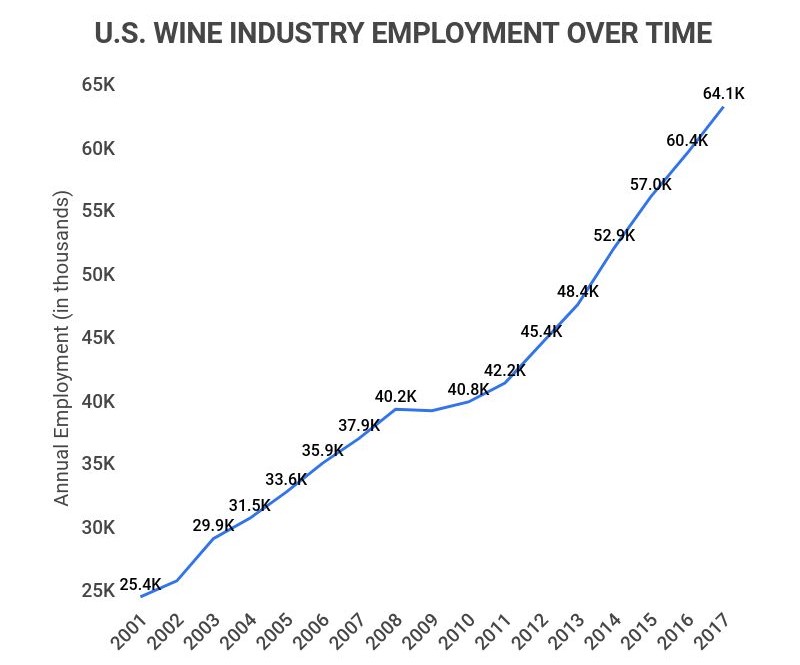
Wineries employ over 64,000 individuals in the U.S.
Approximately 58% of these jobs are concentrated in California, with notable employment in Washington, Oregon, and New York.
-
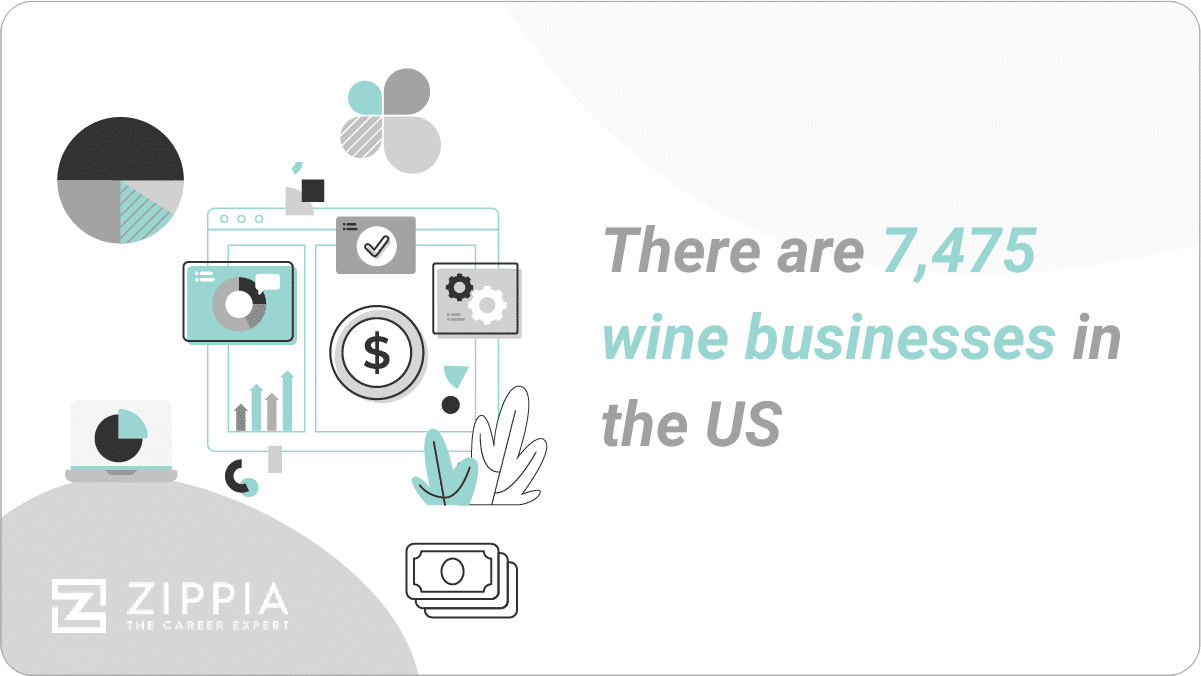
There are over 7,475 wine businesses in the U.S.
California is home to 4,763 of these, representing 43%. The number of wineries in the U.S. has increased by more than 50% since 2009, with continued growth anticipated.
-
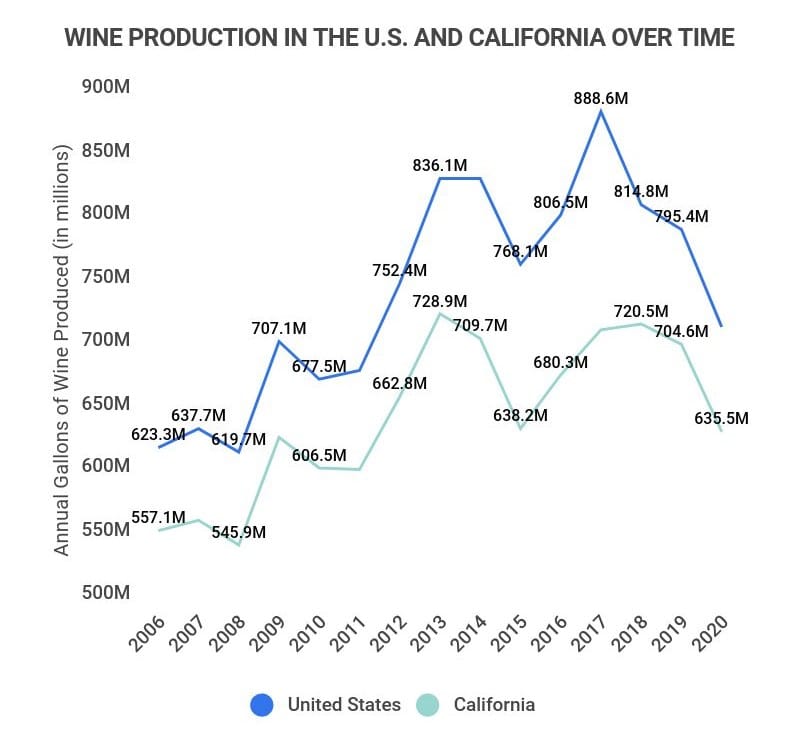
In 2022, the U.S. produced 773 million gallons of wine.
California contributed 649.44 million gallons, approximately 83.9% of the national total.
Global Wine Industry Statistics
-
In 2022, the global wine market generated $350.8 billion in revenue.
This figure is projected to rise to $450.7 billion by 2026.
-
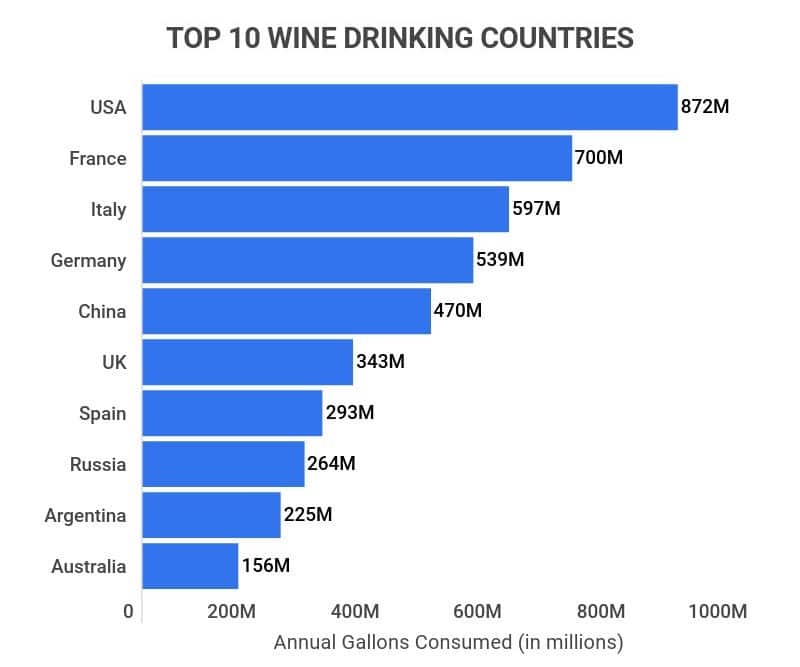
The top five countries for total wine consumption are the U.S., France, Italy, Germany, and China.
Here is the breakdown of wine consumption by each country in 2019:
-
U.S. – 872 million gallons
-
France – 700 million gallons
-
Italy – 597 million gallons
-
Germany – 539 million gallons
-
China – 470 million gallons
The U.K., Spain, Russia, Argentina, and Australia follow as the next largest consumers.
-
-
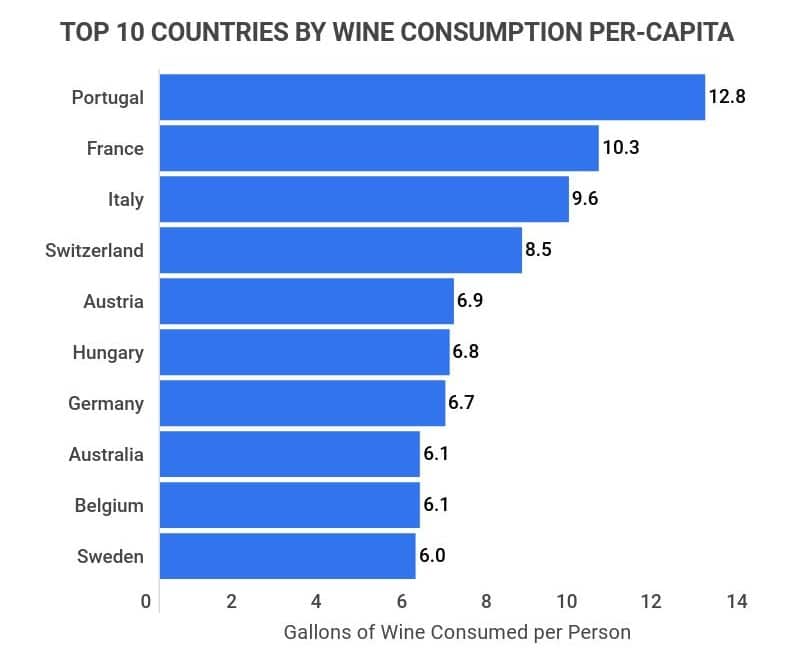
The top five countries for wine consumption per capita are Portugal, France, Italy, Switzerland, and Austria.
Here’s how much wine each country consumes per person yearly:
-
Portugal – 12.8 gallons per person
-
France – 10.3 gallons per person
-
Italy – 9.6 gallons per person
-
Switzerland – 8.5 gallons per person
-
Austria – 6.9 gallons per person
Countries ranked 6-10 include Hungary, Germany, Australia, Belgium, and Sweden.
-
-
The U.S. imported 704 million liters of still wine in 2021.
This marks a decline from 727 million liters in 2019, continuing a trend since imports peaked at one billion liters in 2014. France remains the largest source of U.S. wine imports.
-
The five largest wine companies in the world are E&J Gallo, Constellation Brands, The Wine Group, Treasury Wine Estate, and Viña Concha y Toro.
The breakdown of each company’s gross annual sales is as follows:
-
E&J Gallo – $50 billion
-
Constellation Brands – $16 billion
-
The Wine Group – $1 billion
-
Treasury Wine Estate – $2 billion
-
Viña Concha y Toro – $920 million
-
-
The U.S. leads globally in wine market revenue, earning $49.8 billion in 2020.
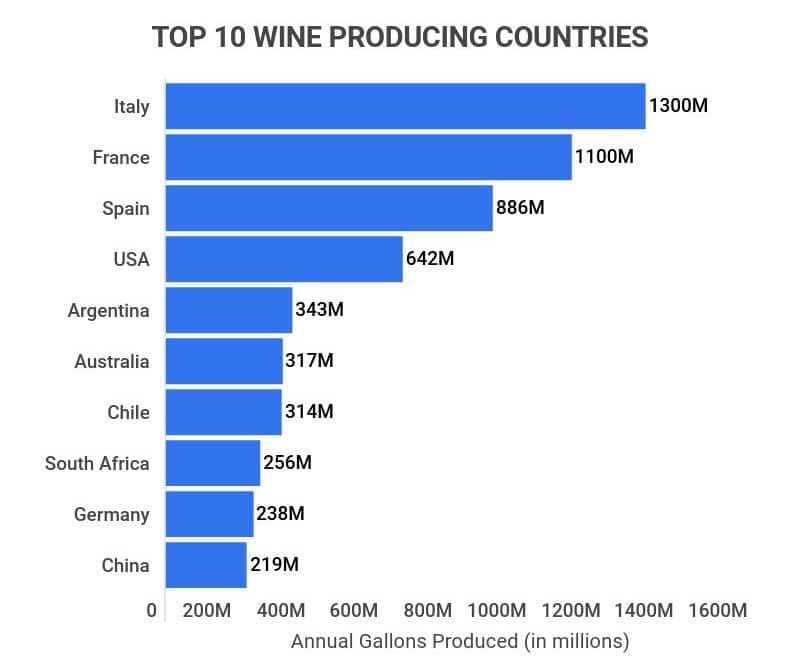
France follows with $25.4 billion, and China with $22.1 billion. However, Italy, France, and Spain were the top three wine producers that same year.
Wine Industry Trends and Projections
-
It’s projected that 281 million cases of wine will be sold in 2023.
These sales are expected to be valued at approximately $32.9 billion, with a CAGR of about 3% anticipated.
-
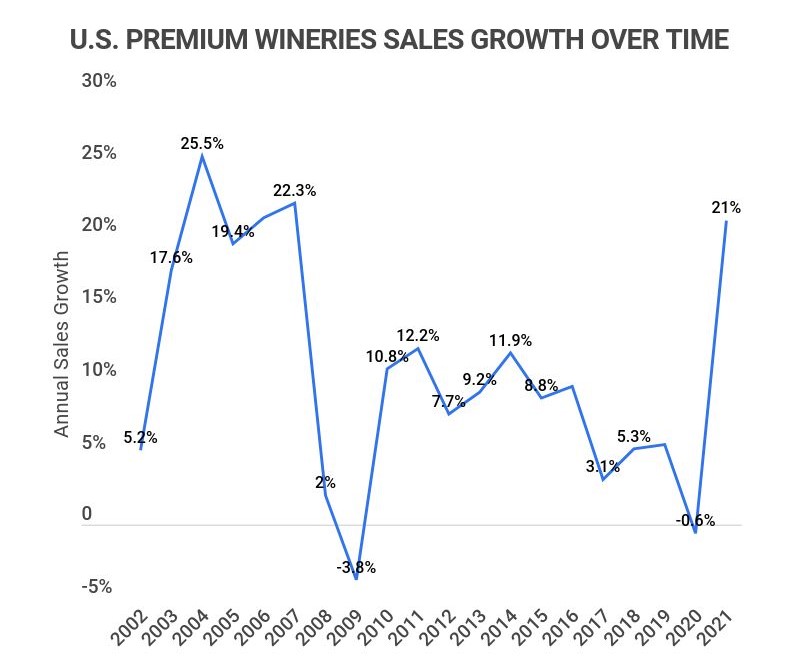
U.S. premium wine sales declined by 7.1% from 2019 to 2020.
This downturn was likely influenced by shifts in consumer behavior due to the pandemic.
-
The global wine industry is expected to be valued at $456.76 billion by 2028.
This represents a CAGR of 4.3% from 2021 to 2028, indicating a recovery trend post-pandemic.
Wine Industry Statistics By Wines
-
Chardonnay is the leading white wine varietal in the U.S.
This versatile wine category achieved $2.549 billion in sales in 2019.
-
Cabernet Sauvignon is the top-selling red wine varietal in the U.S.
Dedicated to its namesake grape, Cabernet Sauvignon surpassed all other wines with $2.575 billion in sales in 2019.
-
Barefoot Wines is the best-selling wine brand in the U.S.
Barefoot, known for its approachable pricing, achieved over $664 million in sales in 2021, while the second most popular brand, Sutter Home, garnered nearly $425.3 million.
Wine Industry Statistics FAQ
-
The global wine industry is valued at over $340 billion. The U.S. generates $49.8 billion in revenue, leading globally.
It is projected to grow to over $456 billion by 2028, with an estimated 281 million cases sold in 2023 worth about $32.9 billion.
-
Yes, the wine industry is on the rise. By 2028, the industry is expected to be worth $456.76 billion, reflecting a CAGR of 4.3% from 2021 to 2028. Although growth has slowed compared to 2015-2019, the market is adapting and recovering post-pandemic.
-
Is the wine industry competitive?
Yes, competition within the wine industry is intense. With over 7,475 wine businesses in the U.S., this number has expanded by 50% since 2009, underlining the competitive nature of the market.
-
Is the wine industry profitable?
Yes, the wine industry is profitable. Despite challenges, global revenue reached over $350 billion in 2020 and is expected to continue increasing, reaching $450.7 billion by 2026.
-
Why is the wine industry fragmented?
The wine industry’s fragmentation arises from the diversity of wine varieties cultivated globally. Different wines require specific climates for grape growth and distinct aging techniques, making it challenging for few companies to dominate.
-
Is wine consumption increasing or decreasing?
Wine consumption is on the rise. An estimated 281 million cases of wine are expected to be sold globally in 2023, valued at about $33 billion, with a CAGR of around 3% anticipated.
Conclusion
Wine remains a significant aspect of many people’s lives, with global consumption in 2021 amounting to 236 million hectoliters.
The U.S. leads the world in total wine consumption, drinking about 872 million gallons per year. However, when measuring per capita consumption, Portugal, France, and Italy dominate with 12.8, 10.3, and 9.6 gallons consumed per person annually, respectively.
Currently valued at approximately $340 billion, the wine industry is projected to see a CAGR of 4.3% from 2021 to 2028, reaching roughly $457 billion.
References
-
Statista. “Total Retail Value of Wine Sales in the United States From 2000 to 2020 (in Billion U.S. Dollars).” Accessed on March 23, 2022.
-
Global Trade. “Report: Imports, Exports, & Production of Wine & Brandy Spirit in U.S. Market.” Accessed on March 23, 2022.
-
Statista. “Wine.” Accessed on March 23, 2022.
-
Statista. “Average Wine Consumption Per United States Resident From 2005 to 2020 (in Gallons).” Accessed on March 23, 2022.
-
Statista. “Wine Consumption Worldwide From 2000 to 2020.” Accessed on March 23, 2022.
-
Statista. “Wine Consumption Worldwide in 2020, by Country (in Million Hectoliters).” Accessed on March 23, 2022.
-
WineAmerica. “United States Wine and Grape Industry FAQs.” Accessed on March 23, 2022.
-
U.S. Bureau of Labor Statistics. “Employment in Wineries Up 153 Percent From 2001 to 2017.” Accessed on March 23, 2022.
-
Statista. “U.S. Wine Market – Statistics & Facts.” Accessed on March 23, 2022.
-
Statista. “Wine Production in the United States and in California From 2006 to 2020 (in Million Gallons).” Accessed on March 23, 2022.
-
Académie du Vin Library. “Wine Statistics.” Accessed on March 23, 2022.
-
Statista. “Volume of U.S. Still Wine Imports From 2006 to 2020 (in Million Liters).” Accessed on March 23, 2022.
-
Statista. “Wine Import Value of the United States in 2020, by Country of Origin.” Accessed on March 23, 2022.
-
Zippia. “10 Largest Wine Companies in the World.” Accessed on March 23, 2022.
-
Statista. “Revenue of the Wine Market Worldwide by Country in 2020.” Accessed on March 23, 2022.
-
Statista. “Wine Production Worldwide in 2020, by Country (in Million Hectoliters).” Accessed on March 23, 2022.
-
Market Research. “Wine Global Industry Guide 2015-2024.” Accessed on March 23, 2022.
-
Statista. “U.S. Premium Wineries Sales Growth From 2002 to 2020.” Accessed on March 23, 2022.
-
Fortune Business Insights. “Wine Market Size, Share & COVID-19 Impact Analysis, By Type (Sparkling Wine, Still Wine, and Others), By Flavor (Red Wine, White Wine, and Rose Wine), By Distribution Channel (On-Trade and Off-Trade), and Regional Forecast, 2021-2028.” Accessed on March 23, 2022.
-
USA Wine Ratings. “Top Wine Varietals of the USA in Terms of Sales.” Accessed on March 23, 2022.
-
Statista. “Sales of the Leading Table Wine Brands in the United States in 2021.” Accessed on March 23, 2022.
- Industry Statistics
- Wedding Industry Statistics
- Yoga Industry Statistics
- Music Industry Statistics
- Landscaping Industry Statistics
- Bicycle Industry Statistics
- Coffee Industry Statistics
- Car Rental Industry Statistics
- Home Improvement Industry Statistics
- Insurance Industry Statistics
- Supplements Industry Statistics
- Golf Industry Statistics
- Fitness Industry Statistics
- US Media And Entertainment Industry Statistics
- Firearm Industry Statistics
- Financial Services Industry Statistics
- Health And Wellness Industry Statistics
- Trucking Industry Statistics
- Wine Industry Statistics
- Pet Industry Statistics
- Mobile App Industry Statistics
- Digital Marketing Industry Statistics
- Hotel Industry Statistics
- Retail Statistics
- Robotics Industry Statistics
- Jewelry Industry Statistics
- Appointment Scheduling statistics
- Restaurant Industry Statistics
- Food Delivery Statistics
- Food Truck Industry
- Fashion Industry
- Real Estate Industry
- US Film Industry
- US Beverage Industry
- USu202fFast Food Restaurants
- US Construction Industry
- US Book Industry
- Cosmetics Industry
- US Food Retail Industry
- US Pharmaceutical Industry
- US Healthcare Industry
- Airline Industry
- Automobile Industry
- Transportation Industry Statistics
- Event Industry Statistics
- Project Management Statistics
- Oil And Gas Industry Statistics
- Nursing Home Statistics
- Nursing Shortage Statistics
- Nursing Statistics
Author
Abby is a writer who is passionate about the power of story. Whether it’s communicating complicated topics in a clear way or helping readers connect with another person or place from the comfort of their couch. Abby attended Oral Roberts University in Tulsa, Oklahoma, where she earned a degree in writing with concentrations in journalism and business.