Research Summary. A visit to university programs today reveals a stark difference in gender representation across disciplines. In technology-related fields, the underrepresentation of women remains a significant challenge, reflecting the ongoing struggle for gender diversity in the tech industry.
Despite advancements, the tech sector continues to see a predominance of male professionals. Our comprehensive analysis reveals the following key statistics:
-
Women occupy 28% of computing and mathematical jobs in the US as of 2025.
-
Women make up 34.4% of the workforce at the largest tech companies, including Amazon, Apple, Facebook, Google, and Microsoft.
-
Women hold 44% of STEM-related bachelor’s degrees as of 2025.
-
Only 15% of engineering jobs are filled by women, highlighting significant underrepresentation in this field.
-
Fewer than 20% of leadership roles in tech are held by women; specifically, 19% of senior vice presidents and 15% of CEOs.
-
74% of girls express an interest in pursuing a STEM career.
-
39% of women in tech perceive gender bias as a barrier to promotion.
-
Women in tech were notably twice as likely as their male counterparts to leave their positions during the workforce shifts seen in recent years.
For a more in-depth look, we categorized the data into several key areas:
Demographics | Trends + Projections | Barriers to Women in Tech | Leadership + Entrepreneurship | Benefits of Women in Tech
General Women in Technology Statistics
-
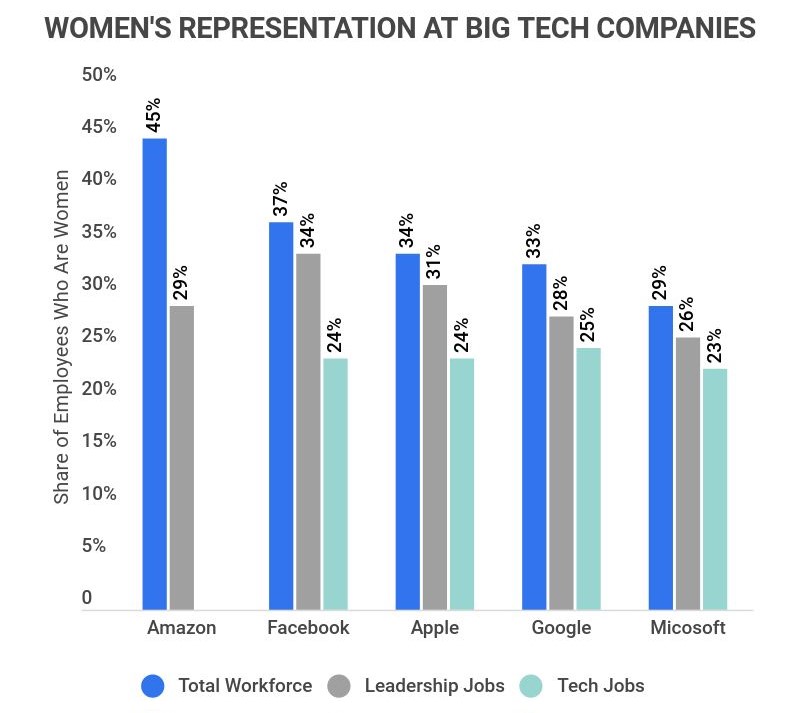
34% of Apple’s workforce is female, while only 24% of its technical positions are occupied by women.
-
37% of Facebook’s workforce is female, but only 24% of its technical jobs are held by women.
-
33% of Google’s workforce is female, with women holding just 25% of technical roles.
-
29% of Microsoft’s workforce is female, while only 23% hold technical positions.
-
Women represent 47% of the overall U.S. workforce.
-
As of 2025, women constitute 28% of the tech industry workforce.
-
26.5% of executive, senior-level, and management roles in S&P 500 companies are held by women.
-
Women occupy only 18% of Chief Information Officer and Chief Technical Officer positions in the largest U.S. tech companies.
-
Just over 25% of software engineers are women.
-
Women remain most underrepresented in physical science (40%), computer (25%), and engineering (15%) roles.
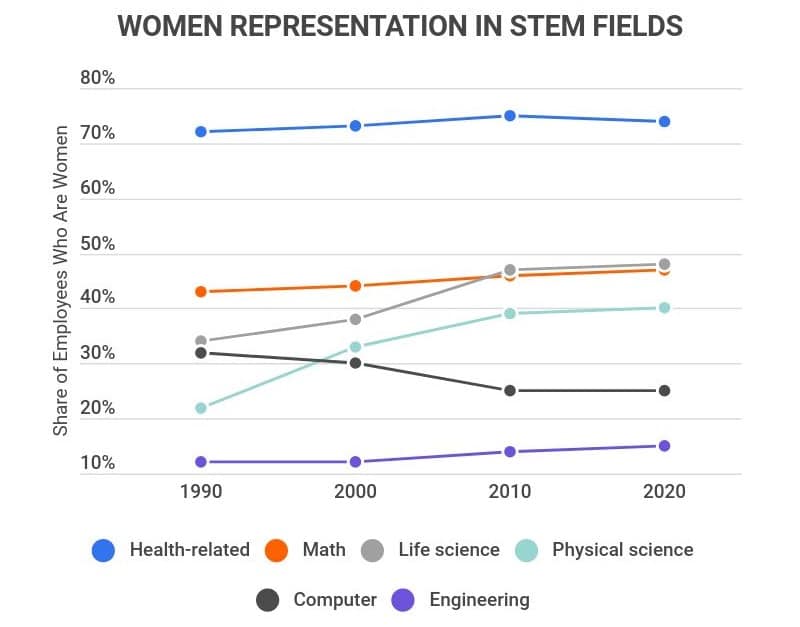
Women Representation in STEM Fields
| Health-Related | Math | Life Science | Physical Science | Computer | Engineering |
|---|---|---|---|---|---|
| 74% | 47% | 48% | 40% | 25% | 15% |
Women in Technology Statistics by Demographics
-
As of 2023, 12% of tech positions in the U.S. are held by women of color.
Breaking it down further: women identifying as Asian or Pacific Islander hold 7%, Black or African American women hold 3%, and Latina or Hispanic women hold 2% of all tech positions in the U.S.
Women identifying as white occupy 13% of all tech jobs in the U.S.
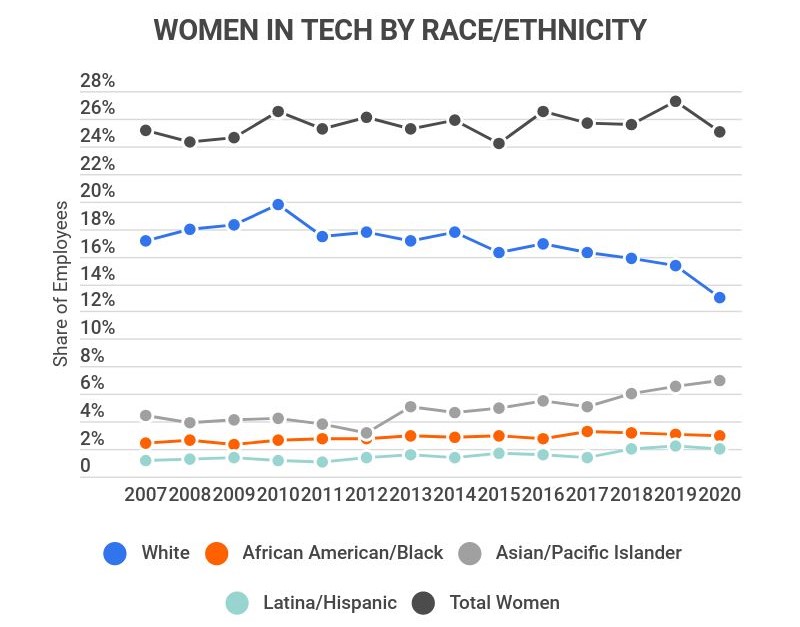
Women in Tech by Race/Ethnicity (2023)
White African American/Black Asian/Pacific Islander Latina/Hispanic Total Women 13% 3% 7% 2% 25% -
Women earned just over 19% of all computer science bachelor’s degrees in 2017.
In contrast, women earned 57.3% of all bachelor’s degrees awarded that year and 49.7% in any science and engineering field, with psychology being the most pursued discipline among female undergraduates, where over 78% of degree earners were women.
Computer science degrees remain among the least pursued by women, with engineering degrees also showing low female representation at almost 22% in 2017.
-
In 2017, 61.5% of science and engineering bachelor’s degrees awarded to Black or African American students were earned by women.
Asian or Pacific Islander female students earned 47.6% of science and engineering degrees, while Hispanic or Latino female students earned 55.6%.
-
As of 2023, wage disparities persist: Asian women earn 5% less than their male counterparts, white women earn 8% less, Black women earn 10% less, and Hispanic women earn 10% less.
In contrast, Asian men earn 1% more than the average salary, while Hispanic and Black men earn 4% and 11% less, respectively.
Women in Technology Statistics: Trends and Predictions
-
In 2015, only 7% of female 15-year-olds were expected to pursue a career in STEM.
In comparison, 26% of male 15-year-olds planned to pursue this career path, indicating a significant gender gap in early career aspirations. Excluding health care careers, 37% of female students expected to enter health fields, while only 9% of males planned to do so.
Overall, 16% of all 15-year-old students anticipated careers in STEM, while 23% were inclined towards health careers.
-
Women held 35% of tech roles in 1984, a figure that dropped to 32% by 2018.
Despite an increase of over two million women in tech jobs over these years, gender ratios have not improved significantly.
This is notable considering women constituted the majority of the computer science workforce during World War II and the 1960s.
-
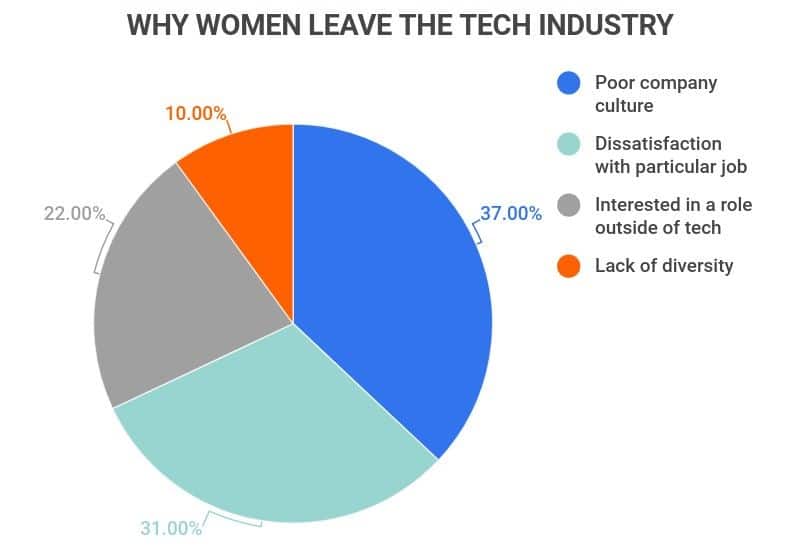
50% of women entering tech roles leave the industry by age 35.
In contrast, only 20% of women in other fields exit by this age. In universities, 37% of women in tech classes drop out, compared to 30% across all degree programs.
This results in women leaving tech at a 45% higher rate than men. The reasons cited include poor company culture (37%), job dissatisfaction (31%), interest in other fields (22%), and lack of diversity (10%).
-
The percentage of bachelor’s degrees in computer science held by women has fluctuated from 13.6% in 1970 to 37% in 1984 and down to 18% in 2021.
While it’s unclear what has driven this decline, the marketing of personal computers predominantly to men has contributed to a perception of women as outsiders in the industry. Educational institutions are increasingly working to reverse this trend by focusing on recruitment and retention of female computer science majors.
Barriers to Women in Technology Statistics
-
As of 2023, 79% of women in tech reported experiencing imposter syndrome, compared to 65% of men.
This trend continues, with 78% of women feeling they must work harder than their peers to prove their worth, while only 54% of men share this sentiment.
-
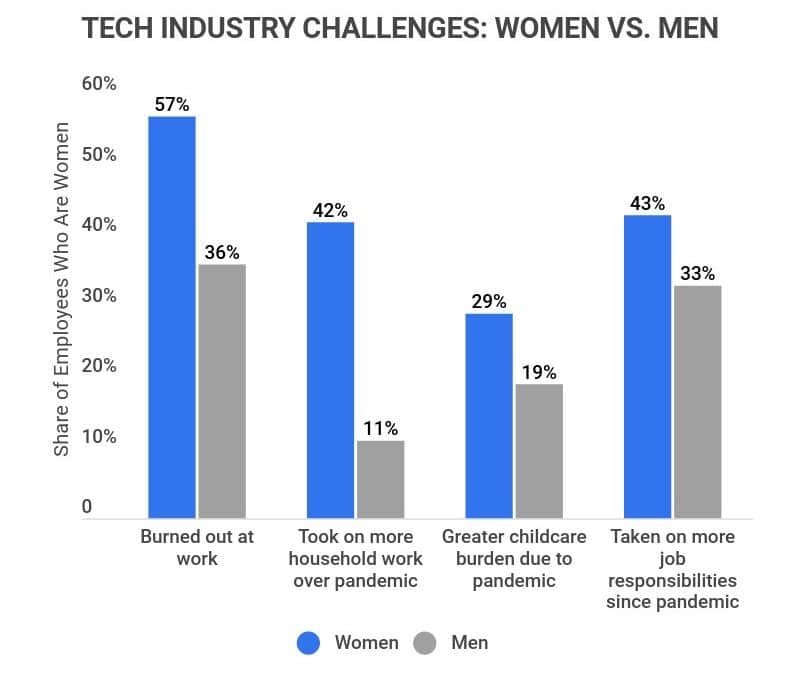
57% of women in tech feel burned out at work, compared to 36% of men.
This burnout can be attributed in part to increased household responsibilities during the pandemic, with 42% of women reporting they took on more domestic work than their partners, while only 11% of men reported being the primary caregivers.
Similarly, 29% of women reported a greater childcare burden compared to 19% of men.
In the workplace, 43% of women stated they have taken on more responsibilities since the pandemic began, versus 33% of men.
-
Women in tech were nearly twice as likely as men to leave their jobs or be laid off during recent workforce changes.
While many of these job losses were beyond their control, some were related to increased caregiving responsibilities.
-
39% of surveyed women in tech identify gender bias as a barrier to promotions.
In contrast, only 8% of male counterparts felt that gender bias hindered their promotion opportunities.
-
72% of women and over 50% of men in tech believe women are outnumbered by men in meetings at least two to one.
More than a quarter of women reported even greater disparities, with ratios of five or more men to one woman in meetings.
-
60% of women of color and 69% of white women in tech cite the lack of a clear advancement path as a significant barrier to promotions.
This exceeds the roughly 40% who reported gender bias as a promotion obstacle. Even when hiring managers do not consciously disqualify women based on gender, the lack of clear paths to advancement limits their promotion opportunities.
Many companies are recognizing the importance of providing women with mentorship and clearer pathways to advancement, fostering a more inclusive environment.

Women in Technology Statistics by Leadership and Entrepreneurship
-
Women hold over 26% of executive, senior-level, and management positions within S&P 500 companies.
-
Research shows that Fortune 1000 companies led by female CEOs achieve three times the returns of those led by men.
-
Within the top five tech companies (Amazon, Apple, Facebook, Google, and Microsoft), the leadership breakdown is:
-
Women hold 29% of leadership positions at Amazon.
-
Women hold 31% of leadership positions at Apple.
-
Women occupy 34% of leadership roles at Facebook.
-
Women hold 28% of leadership positions at Google.
-
Women occupy 26% of leadership roles at Microsoft.
-
-
In 2019, startups founded solely by women received 6% of global venture capital funding, while mixed-gender startups received 10%.
-
20% of global startups had a female founder in 2019.
-
In 2019, startups with a sole female founder attracted $6.1 billion in venture investments, while those with at least one male co-founder received $20.6 billion.
Women in Technology Statistics by Top Benefits
-
In 2017, organizations with at least eight female managers out of every 20 generated about 34% of their revenue from innovative products and services.
In contrast, companies with only one female manager per 20 produced only 25% of their revenue from innovation, underscoring the value of diverse perspectives.
-
In 2020, companies in the Fortune 500 with at least three women in leadership roles saw a 66% increase in ROI.
These companies collectively wield significant purchasing power, estimated at $5 trillion, highlighting the risks of not integrating women into leadership roles.
-
52% of women believe companies would attract more females to tech roles by showcasing female role models.
Female students pursuing tech degrees are 27% more likely to seek tech jobs when they have positive perceptions of tech workers. Visible female role models significantly influence their academic and career choices.
Tech companies that prioritize hiring and promoting women are better positioned to attract a diverse workforce and harness the benefits of diversity.
Technology Industry Definitions
-
Technology Industry (or Sector): This industry encompasses businesses that provide goods and services across various IT fields, including software, hardware, and electronic services. For the purposes of this article, IT roles are included even if they are not within tech companies.
-
Technical Jobs: This term refers to roles specific to the technology sector, such as software developers or IT technicians. Administrative roles, even in tech companies, are not classified as technical jobs.
Women in Technology Statistics FAQ
-
What percentage of technology degrees are held by women?
-
What is the ratio of men to women in the technology industry?
The ratio of men to women in the technology industry is approximately 3:1. This statistic is based on the fact that only 25% of computing and mathematical jobs in the U.S. are held by women. A broader perspective on the tech industry brings this ratio closer to 2:1, confirming that men greatly outnumber women in tech environments.
-
What percentage of tech CEOs are women?
15% of tech CEOs are women. Given that women hold 37% of entry-level tech roles and 19% of senior vice president positions, there is a notable gender gap at every career level in tech.
44% of STEM-related bachelor’s degrees are earned by women. While this is on par with men, it’s important to note that women earn 58% of all college degrees, indicating significant room for improvement in STEM fields.
Final Thoughts
Women have played a crucial role in the tech industry since its inception, yet they remain significantly underrepresented and are leaving the field at alarming rates. Furthermore, fewer women are entering tech, which exacerbates the gender diversity crisis.
While many companies are making commendable efforts to create inclusive environments for women and other minorities, there is still much work to be done.
One effective strategy for tech firms to improve gender diversity is to establish clear career pathways and provide accessible role models. Many women have indicated that these changes could greatly enhance their experiences in this male-dominated field.
Though implementing these changes requires effort, the benefits are substantial, as diverse workplaces foster innovation and drive success.
References
-
Statista. “Female Workers in the Tech Industry: Women’s Representation in Big Tech.” Accessed in 2023.
-
Statista. “Percentage of Employed Women in Computing-Related Occupations in the United States from 2007 to 2023, by Ethnicity.” Accessed in 2023.
-
Accenture. “Resetting Tech Culture: 5 Strategies To Keep Women in Tech.” Accessed in 2023.
-
Zippia. “Software Engineer Demographics and Statistics in the U.S.” Accessed in 2023.
-
NCSES. “Demographic Attributes of SE Degree Recipients.” Accessed in 2023.
-
Hired.com. “Hired’s 2021 Impact Report – Wage Inequality in the Workplace.” Accessed in 2023.
-
NCES. “Health and STEM Career Expectations and Science Literacy Achievement of U.S. 15-Year-Old Students.” Accessed in 2023.
-
Computerscience.org. “Women in Computer Science: Getting Involved in STEM.” Accessed in 2023.
-
Trustradius. “2020 Women in Tech Report.” Accessed in 2023.
-
Trustradius. “TrustRadius 2021 Women in Tech Report.” Accessed in 2023.
-
Statista. “Biggest Barriers for Getting Promoted Among Women in the Technology Industry in 2021, by Race.” Accessed in 2023.
-
Fortune. “Women-led Companies Perform Three Times Better Than the SP 500.” Accessed in 2023.
-
Crunchbase. “EoY 2019 Diversity Report: 20 Percent of Newly Funded Startups in 2019 Have a Female Founder.” Accessed in 2023.
-
BCG. “The Mix That Matters: Innovation Through Diversity.” Accessed in 2023.
-
Forbes. “Top Three Reasons We Need More Women in Tech.” Accessed in 2023.
-
Investopedia. “Technology Sector.” Accessed in 2023.
-
Pew Research Center. “6 facts about America’s STEM workforce and those training for it.” Accessed in 2023.
Author
Abby is a writer who is passionate about the power of story. Whether it’s communicating complicated topics in a clear way or helping readers connect with another person or place from the comfort of their couch. Abby attended Oral Roberts University in Tulsa, Oklahoma, where she earned a degree in writing with concentrations in journalism and business.