- Tech Industry Statistics
- MFA Statistics
- Streaming Services Statistics
- Mobile Vs. Desktop Usage Statistics
- AI Statistics
- Live Streaming Statistics
- Zoom Meeting Statistics
- Cord Cutting Statistics
- Digital Transformation Statistics
- Virtual Reality Statistics
- How Fast Is Technology Advancing
- Mobile Commerce Statistics
- SaaS Statistics
- Machine Learning Statistics
- Diversity In High Tech
- Cyber Security Statistics
- Ecommerce Statistics
- Tech Industry
- Gaming Industry
- Renewable Energy Job Creation
- Smartphone Industry
- Cybercrime Statistics
- Amazon Statistics
- Personalization Statistics
25+ Amazon Statistics [2026]: Facts About The Largest U.S. E-Commerce Market
Amazon Research Summary. In 2026, it is hard to envision a world where Amazon is not a pivotal part of our shopping experience. As the largest e-commerce marketplace in the U.S., Amazon significantly shapes online shopping behaviors. To illustrate its magnitude, we have conducted comprehensive research revealing the following insights:
-
The Amazon app boasts over 197 million monthly active users (MAUs).
-
Amazon’s share of U.S. e-commerce sales surged to an impressive 56.7% in 2021.
-
There are over 12 million products available for sale on Amazon.
-
Approximately 70% of American adults are Amazon Prime members, equating to 148.6 million individuals.
-
31% of U.S. adults spend between $50-$100 per month on Amazon.
-
Amazon’s total net sales revenue reached $514 billion in 2022.
For deeper insights, we have categorized the data as follows:
Amazon Shoppers | Amazon Prime Members | Sales, Shipping, and Fulfillment Centers | Amazon Seller | Trends and Projections
Amazon Statistics by Amazon Shoppers
Amazon’s success is largely due to its popularity among consumers. Here’s how it stacks up in terms of user engagement:
-
Amazon attracts 2.72 billion unique monthly visitors in 2026.
This figure is more than double that of eBay, which sees around 885 million visits monthly. Walmart, lagging behind, has over 410 million visits.
-
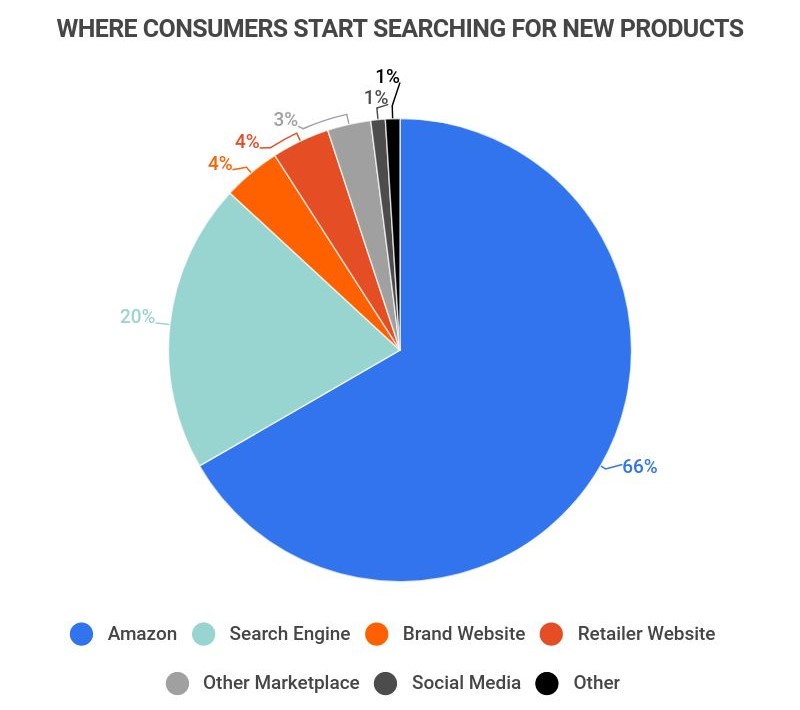
89% of U.S. consumers prefer purchasing from Amazon over other e-commerce sites.
Nearly nine out of ten Americans opt to shop on Amazon first, with 66% of online consumers beginning their product searches there.
-
Amazon has over 310 million active users globally.
This user base exceeds the population of Indonesia, the fourth most populous country in the world.
-
Amazon is the second most popular shopping app in the U.S., boasting over 98 million MAUs.
While Walmart leads with 120 million MAUs, Amazon is rapidly closing the gap.
-
51% of consumers turn to Amazon for product inspiration.
Similar to search engines, many shoppers use Amazon as a primary resource for discovering new products.
-
70% of online shoppers utilize Amazon to compare prices.
Amazon’s extensive inventory positions it as a go-to platform for consumers seeking the best deals.
Amazon Statistics by Amazon Prime Members
Amazon Prime membership is a popular option among users, and here’s why:
-
Approximately 74.3% of global Amazon Prime members reside in the U.S.
Out of over 200 million Prime members worldwide, 148.6 million are in America, with significant numbers also from Japan, the U.K., and Germany.
-
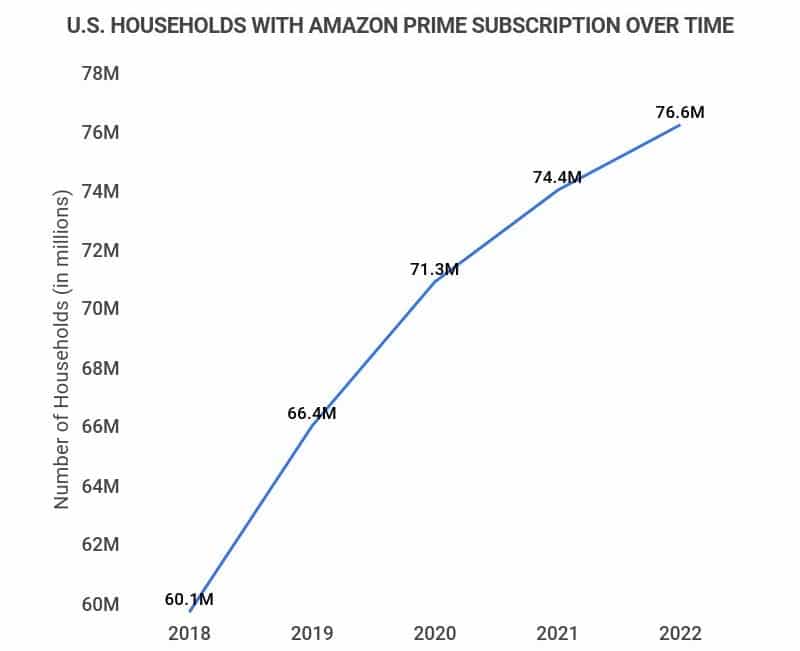
As of 2022, 76.6 million U.S. households hold Amazon Prime memberships.
Nearly 67% of all U.S. households have Prime, reflecting a 27% increase since 2018.
-
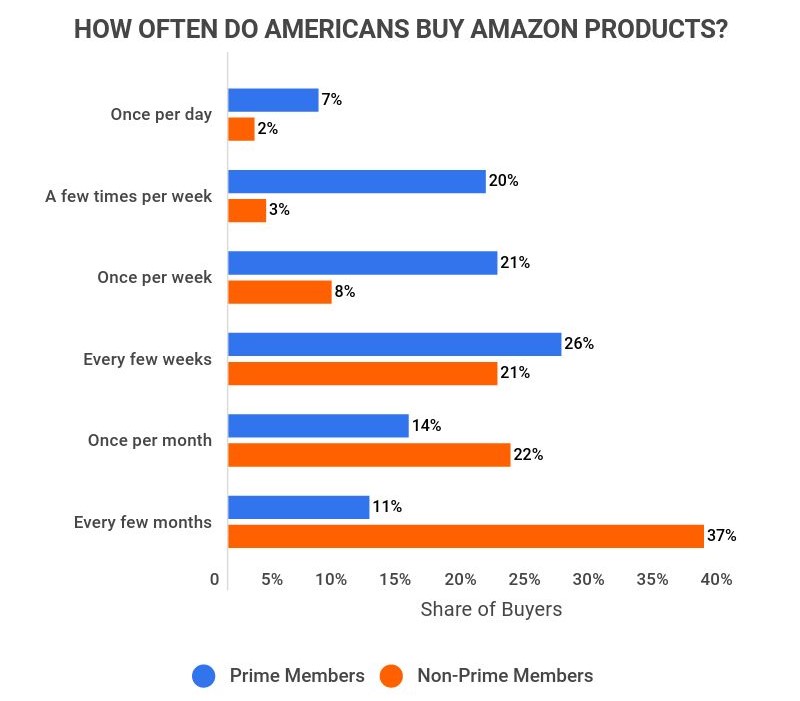
U.S. Amazon Prime members spend an average of $1,968 annually.
Prime members exhibit strong loyalty, spending four times more than non-members.
Amazon Statistics by Sales, Shipping, and Fulfillment Centers
Amazon’s ability to deliver on its promises is facilitated by a network of efficient fulfillment centers:
-
Amazon processes 18.5 orders per second.
This translates to 66,000 orders per hour and approximately 1.6 million orders daily.
-
There are currently 110 active Amazon fulfillment centers in the U.S.
This represents about 60% of all Amazon fulfillment centers globally, which number at least 185.
-
Amazon employs 1.541 million individuals in the U.S.
One in every 153 Americans works for Amazon in various roles, including delivery and warehouse positions.
Amazon Statistics by Amazon Sellers
The vast array of products on Amazon is partly due to its extensive network of sellers:
-
There are 9.7 million sellers on Amazon worldwide.
However, only 1.9 million are active, representing about 20% of all sellers.
-
341 million products are sold through Amazon sellers.
This means that 96.5% of all products on Amazon come from third-party sellers.
-
80% of Amazon sellers also operate on other platforms.
Many sellers diversify their income by selling on multiple platforms, with 37% maintaining full-time jobs outside of Amazon.
-
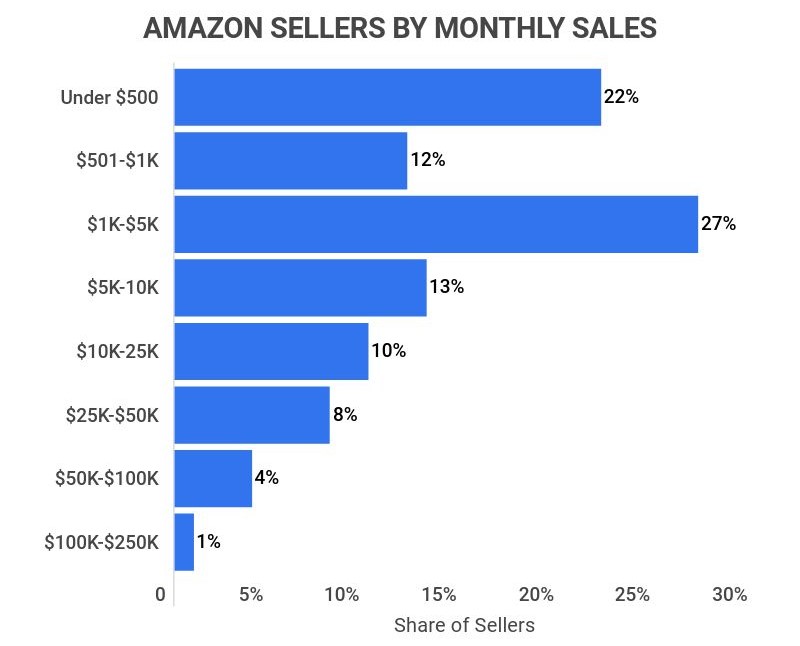
62% of Amazon sellers earn less than $5,000 monthly.
The majority of sellers make between $1,001-$5,000 (27%), while only 5% earn $50,000 or more monthly.
-
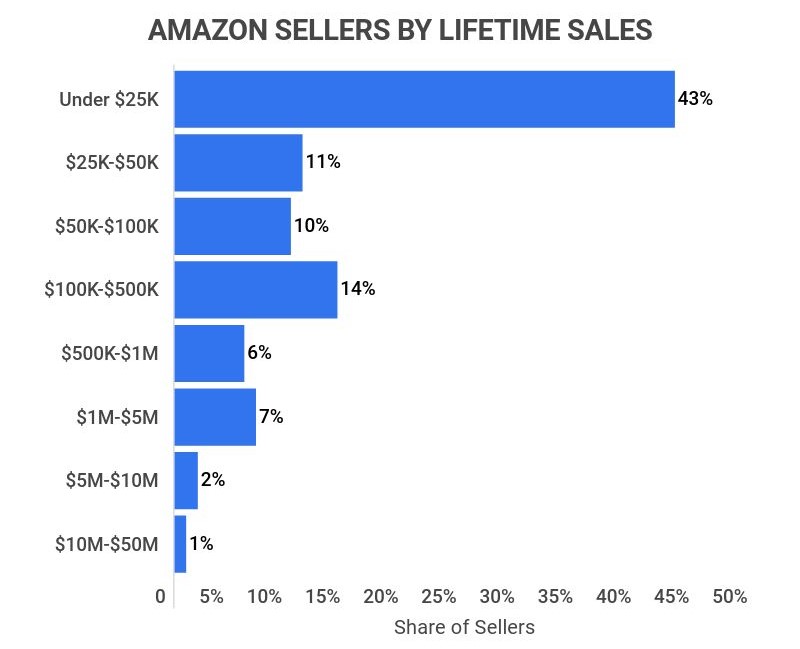
30% of sellers have achieved lifetime sales exceeding $100,000.
While 43% have lifetime sales under $25,000, a significant portion has made more.
Amazon Trends and Projections
Amazon’s position as the leading e-commerce site in the U.S. is a relatively recent development, and understanding its trajectory can provide insights into its future:
-
From 2005 to 2020, Amazon’s annual revenue grew 45 times.
In 2005, revenue was $8.4 billion, escalating to $386 billion by 2020, with annual growth averaging between 25-40%.
Year Annual Revenue (in billions) 2005 $8.4B 2006 $10.7B 2007 $14.8B 2008 $19.1B 2009 $24.5B 2010 $34.2B 2011 $48.0B 2012 $61.0B 2013 $74.4B 2014 $88.9B 2015 $107.0B 2016 $135.9B 2017 $177.8B 2018 $232.8B 2019 $280.5B 2020 $386.0B -
Between 2014 and 2020, Amazon’s AWS and Subscription Services segments experienced over 800% growth.
While the Online Stores segment remains the largest, AWS and Subscription Services have shown the fastest growth rates. Specifically, AWS revenue surged from $4.6 billion to $45.3 billion (885%), and Subscription Services increased from $2.7 billion to $25.2 billion (833%).
Year Online Stores Physical Stores Third-Party Retail Subscription Services AWS Other 2014 $68.5B $11.7B $2.7B $4.6B $1.3B 2015 $76.8B $16.0B $4.4B $7.8B $1.7B 2016 $91.4B $22.9B $6.3B $12.2B $2.9B 2017 $108.3B $5.8B $31.8B $9.7B $17.4B $4.6B 2018 $122.9B $17.2B $42.7B $14.1B $25.6B $10.1B 2019 $141.2B $17.1B $53.7B $19.2B $35.0B $14.0B 2020 $197.2B $16.2B $80.4B $25.2B $45.3B $21.4B -
From 2006 to 2020, Amazon’s North American revenue grew 41 times larger.
Amazon’s North American revenue growth has consistently outpaced its international revenue, which only grew about 20 times during the same period.
Year North American Revenue (in billions) International Revenue (in billions) 2006 $5.6B $4.8B 2007 $8.1B $6.7B 2008 $10.2B $8.9B 2009 $12.8B $11.6B 2010 $18.7B $15.5B 2011 $26.7B $21.3B 2012 $34.8B $26.2B 2013 $44.5B $29.9B 2014 $50.8B $33.5B 2015 $63.7B $35.4B 2016 $79.7B $43.9B 2017 $106.1B $54.3B 2018 $141.3B $65.8B 2019 $170.7B $74.7B 2020 $236.2B $104.4B -
Between 2005 and 2020, Amazon’s profit expanded by 58 times.
Annual profit grew from $359 million in 2005 to an impressive $21.3 billion by 2020.
Year Annual Profit 2005 $359M 2006 $190M 2007 $476M 2008 $645M 2009 $902M 2010 $1.15B 2011 $631M 2012 $39M 2013 $274M 2014 $241M 2015 $596M 2016 $2.37B 2017 $3.03B 2018 $10.07B 2019 $11.58B 2020 $21.33B -
Currently, there are 200 million global Amazon Prime members.
The membership base has seen rapid growth, with a notable 78.6% increase between 2019 and 2020.
Year Number of Amazon Prime Subscribers (in millions) 2016 46M 2017 66M 2018 100M 2019 120M 2020 150M 2021 200M -
There are 148.6 million U.S. Amazon Prime members.
U.S. members constitute the majority of global Prime subscriptions, with a 291% increase from 2016 to 2021.
Year Number of U.S. Amazon Prime Subscribers (in millions) 2016 38M 2017 60M 2018 93M 2019 103M 2020 118M 2021 148M
Amazon Statistics FAQ
-
How much does Amazon sell every day?
Amazon ships 1.6 million packages valued at over $385 million daily. This remarkable volume translates to 66,000 orders each hour and 18.5 orders per second.
-
How many people use Amazon?
Amazon has more than 310 million active users globally. This number exceeds the population of Indonesia, with approximately 64.5% being Prime members (200 million).
-
Which country uses Amazon the most?
The United States has the largest Amazon user base. With 148.6 million Prime members, the U.S. comprises about 74.3% of global memberships.
Furthermore, 76.6 million U.S. households have Prime memberships, indicating that nearly 67% of all U.S. households are Prime members, a 27% increase from 2018.
-
Which state uses Amazon the most?
North Carolina leads in Amazon usage relative to population size. The state has an Amazon obsession score of 69.89%, with 70% of its population relying on the platform. Other high-ranking states include Texas (69.75%), Virginia (67.48%), Kansas (67.07%), and Florida (66.67%). Notably, Austin, Texas, boasts the highest Amazon sales, with an average annual spend of $1,807 per buyer.
-
How many fulfillment centers does Amazon have?
Currently, there are 110 active fulfillment centers in the U.S. This accounts for around 60% of Amazon’s total fulfillment centers, which number at least 185 globally.
-
How many people does Amazon employ?
Amazon employs approximately 1,541,000 individuals. A substantial number of Americans work for Amazon in roles ranging from delivery drivers to warehouse staff, making it so that one in every 153 Americans is employed by the company.
Conclusion
As the preeminent e-commerce market in the U.S., Amazon continues to grow exponentially. Over the past five years, Amazon Prime memberships have skyrocketed from 46 million to 200 million, while the company’s revenue has increased 45 times since 2005.
These figures illustrate why Amazon currently offers 351 million products sold through its platform and third-party sellers, all supported by a workforce of over 1.5 million employees operating from 185 extensive fulfillment centers.
Given these trends, it’s clear that Amazon is poised for continued growth and dominance in the e-commerce landscape.
Sources:
-
Pymnts. “Amazon’s Share of US eCommerce Sales Hits All-Time High of 56.7% in 2021.” Accessed on May 9th, 2022.
-
Retail TouchPoints. “How Many Products Does Amazon Carry?” Accessed on May 9th, 2022.
-
Backlinko. “Amazon Prime User and Revenue Statistics (2022).” Accessed on May 9th, 2022.
-
Statista. “Annual net sales revenue of Amazon from 2006 to 2021, by segment.” Accessed on May 9th, 2022.
-
Statista. “Leading e-commerce websites in the United States as of June 2021, based on number of monthly visits.” Accessed on May 9th, 2022.
-
Forbes. “89% Of Consumers Are More Likely To Buy Products From Amazon Than Other E-Commerce Sites: Study.” Accessed on May 9th, 2022.
-
Statista. “Annual net sales of Amazon in selected leading markets from 2014 to 2021.” Accessed on May 9th, 2022.
-
Statista. “Leading shopping apps in the United States in 2021, by average number of monthly active users.” Accessed on May 9th, 2022.
-
iPaper. “Shoppers don’t visit your online store for inspiration.” Accessed on May 9th, 2022.
-
Martech. “Nearly 70 percent of online shoppers use Amazon to compare products found on a brand’s website.” Accessed on May 9th, 2022.
-
Statista. “Total number of households in the United States with an Amazon Prime subscription from 2018 to 2022.” Accessed on May 10th, 2022.
-
Statista. “Number of paying Amazon Prime members worldwide from 2015 to 2020.” Accessed on May 10th, 2022.
-
Quartz. “Prime has never been more important to Amazon.” Accessed on May 10th, 2022.
-
FBA Help. “Locations of Amazon Fulfillment Centers.” Accessed on May 10th, 2022.
-
Insider. “1 out of every 153 American workers is an Amazon employee.” Accessed on May 10th, 2022.
-
Oberlo. “10 Amazon Statistics You Need To Know in 2021 [Infographic].” Accessed on May 10th, 2022.
-
PracticalEcommerce. “Everything to Know about Amazon Marketplace Sellers.” Accessed on May 10th, 2022.
-
JungleScout. “How Much Money Do Amazon Sellers Make?” Accessed on May 10th, 2022.
-
BusinessofApps. “Amazon Statistics (2022).” Accessed on May 10th, 2022.
-
Statista. “Leading cities in the United States ranked by average annual spending per Amazon buyer in 2017.” Accessed on May 10th, 2022.
- Tech Industry Statistics
- MFA Statistics
- Streaming Services Statistics
- Mobile Vs. Desktop Usage Statistics
- AI Statistics
- Live Streaming Statistics
- Zoom Meeting Statistics
- Cord Cutting Statistics
- Digital Transformation Statistics
- Virtual Reality Statistics
- How Fast Is Technology Advancing
- Mobile Commerce Statistics
- SaaS Statistics
- Machine Learning Statistics
- Diversity In High Tech
- Cyber Security Statistics
- Ecommerce Statistics
- Tech Industry
- Gaming Industry
- Renewable Energy Job Creation
- Smartphone Industry
- Cybercrime Statistics
- Amazon Statistics
- Personalization Statistics
Author
Jack Flynn is a writer for Zippia. In his professional career he’s written over 100 research papers, articles and blog posts. Some of his most popular published works include his writing about economic terms and research into job classifications. Jack received his BS from Hampshire College.