Best cities for a process/product engineer
The best cities for process/product engineers are Las Vegas, NV, North Las Vegas, NV, and San Antonio, TX, based on factors like average salary and job availability per capita. Jobs and pay for process/product engineers vary across the country, but we've determined the ten best cities for process/product engineers in the U.S.
Whether you're starting your career as a process/product engineer or considering a move, this list of the best cities for process/product engineers to live in will help you decide. These aren't just the best-paying cities for process/product engineers. We also consider how easy it is to find work as a process/product engineer. While the absolute best city for process/product engineers is Las Vegas, NV, there are plenty of other great places to consider.
Keep reading to learn more about the best cities for process/product engineers in 2024.
If you're looking for a process/product engineer job, here are five companies hiring now:
10 best cities for process/product engineers in 2025
1. Las Vegas, NV
Total process/product engineer jobs: 0 Average annual salary: $90,446 Lowest 10 percent warn: $66,000 Highest 10 percent earn: $123,000 Location quotient: 0.00 2. North Las Vegas, NV
Total process/product engineer jobs: 0 Average annual salary: $90,411 Lowest 10 percent warn: $66,000 Highest 10 percent earn: $123,000 Location quotient: 0.00 3. San Antonio, TX
Total process/product engineer jobs: 0 Average annual salary: $90,744 Lowest 10 percent warn: $66,000 Highest 10 percent earn: $123,000 Location quotient: 0.00 4. Austin, TX
Total process/product engineer jobs: 0 Average annual salary: $90,707 Lowest 10 percent warn: $66,000 Highest 10 percent earn: $123,000 Location quotient: 0.00 5. Detroit, MI
Total process/product engineer jobs: 4 Average annual salary: $91,745 Lowest 10 percent warn: $68,000 Highest 10 percent earn: $122,000 Location quotient: 14.41 6. Houston, TX
Total process/product engineer jobs: 0 Average annual salary: $90,265 Lowest 10 percent warn: $66,000 Highest 10 percent earn: $122,000 Location quotient: 0.00 7. Laredo, TX
Total process/product engineer jobs: 0 Average annual salary: $90,238 Lowest 10 percent warn: $66,000 Highest 10 percent earn: $123,000 Location quotient: 0.00 8. Reno, NV
Total process/product engineer jobs: 0 Average annual salary: $93,059 Lowest 10 percent warn: $68,000 Highest 10 percent earn: $126,000 Location quotient: 0.00 9. Fort Worth, TX
Total process/product engineer jobs: 0 Average annual salary: $89,865 Lowest 10 percent warn: $66,000 Highest 10 percent earn: $121,000 Location quotient: 0.00 10. Wichita, KS
Total process/product engineer jobs: 0 Average annual salary: $90,409 Lowest 10 percent warn: $68,000 Highest 10 percent earn: $120,000 Location quotient: 0.00
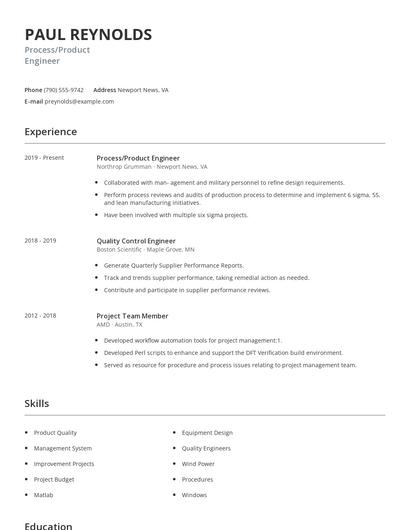
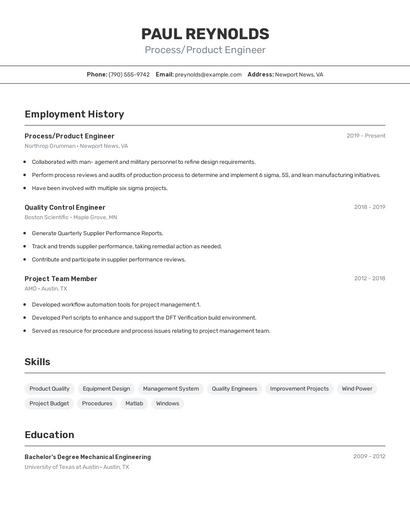
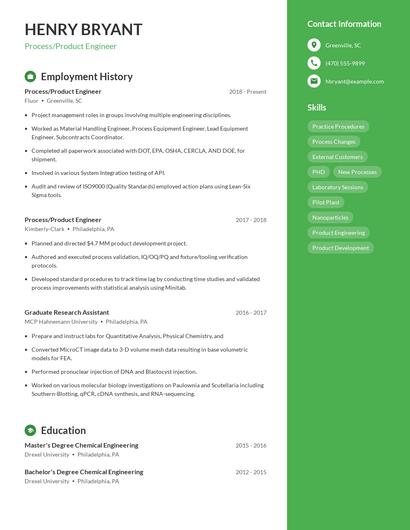
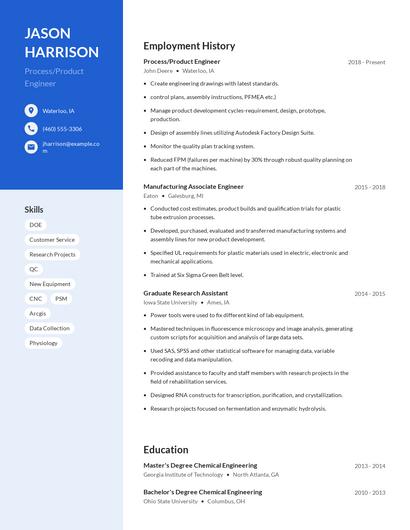
Choose from 10+ customizable process/product engineer resume templates
Choose from a variety of easy-to-use process/product engineer resume templates and get expert advice from Zippia’s AI resume writer along the way. Using pre-approved templates, you can rest assured that the structure and format of your process/product engineer resume is top notch. Choose a template with the colors, fonts & text sizes that are appropriate for your industry.


Best cities for process/product engineers
- Las Vegas, NV
- North Las Vegas, NV
- San Antonio, TX
- Austin, TX
- Detroit, MI
- Houston, TX
- Laredo, TX
- Reno, NV
- Fort Worth, TX
- Wichita, KS
- (0 process/product engineer jobs)
- (0 process/product engineer jobs)
- (0 process/product engineer jobs)
- (0 process/product engineer jobs)
- (4 process/product engineer jobs)
- (0 process/product engineer jobs)
- (0 process/product engineer jobs)
- (0 process/product engineer jobs)
- (0 process/product engineer jobs)
- (0 process/product engineer jobs)
Detailed list of the best cities for a process/product engineer
| Rank | City | Average salary | Lowest 10% Earn | Population | Job count |
|---|---|---|---|---|---|
| 1 | Las Vegas, NV | $90,446 | $66,000 | 632,912 | - |
| 2 | North Las Vegas, NV | $90,411 | $66,000 | 238,702 | - |
| 3 | San Antonio, TX | $90,744 | $66,000 | 1,492,510 | - |
| 4 | Austin, TX | $90,707 | $66,000 | 947,890 | - |
| 5 | Detroit, MI | $91,745 | $68,000 | 672,795 | 4 |
| 6 | Houston, TX | $90,265 | $66,000 | 2,303,482 | - |
| 7 | Laredo, TX | $90,238 | $66,000 | 257,156 | - |
| 8 | Reno, NV | $93,059 | $68,000 | 245,255 | - |
| 9 | Fort Worth, TX | $89,865 | $66,000 | 854,113 | - |
| 10 | Wichita, KS | $90,409 | $68,000 | 389,902 | - |
| 11 | Arlington, TX | $89,831 | $66,000 | 392,772 | - |
| 12 | El Paso, TX | $92,385 | $68,000 | 683,080 | - |
| 13 | Lubbock, TX | $90,775 | $67,000 | 252,506 | - |
| 14 | Dallas, TX | $89,708 | $66,000 | 1,317,929 | - |
| 15 | Irving, TX | $89,700 | $66,000 | 238,289 | - |
| 16 | Oklahoma City, OK | $88,089 | $65,000 | 638,367 | - |
| 17 | Philadelphia, PA | $87,712 | $64,000 | 1,567,872 | - |
| 18 | Garland, TX | $89,548 | $66,000 | 234,943 | - |
| 19 | Plano, TX | $89,474 | $66,000 | 286,057 | - |
| 20 | Cleveland, OH | $84,590 | $63,000 | 385,809 | - |
| 21 | Henderson, NV | $89,975 | $65,000 | 292,969 | - |
| 22 | Corpus Christi, TX | $89,963 | $65,000 | 325,733 | - |
| 23 | Glendale, AZ | $91,270 | $67,000 | 245,895 | - |
| 24 | Phoenix, AZ | $91,252 | $67,000 | 1,615,017 | - |
| 25 | Scottsdale, AZ | $91,223 | $67,000 | 246,645 | - |
| 26 | Chandler, AZ | $91,065 | $67,000 | 247,477 | - |
| 27 | Mesa, AZ | $91,056 | $67,000 | 484,587 | - |
| 28 | Gilbert, AZ | $91,036 | $67,000 | 237,133 | - |
| 29 | Toledo, OH | $83,274 | $62,000 | 278,508 | - |
| 30 | Tucson, AZ | $90,516 | $67,000 | 530,706 | - |
| 31 | Boston, MA | $98,858 | $71,000 | 673,184 | - |
| 32 | Atlanta, GA | $90,109 | $67,000 | 472,522 | - |
| 33 | New Orleans, LA | $88,123 | $64,000 | 391,495 | - |
| 34 | Tulsa, OK | $85,637 | $64,000 | 403,090 | - |
| 35 | Columbus, OH | $82,709 | $62,000 | 860,090 | - |
| 36 | Virginia Beach, VA | $98,977 | $73,000 | 452,602 | - |
| 37 | Denver, CO | $90,140 | $66,000 | 693,060 | - |
| 38 | Pittsburgh, PA | $84,966 | $63,000 | 303,625 | - |
| 39 | San Francisco, CA | $106,176 | $77,000 | 870,887 | 2 |
| 40 | Norfolk, VA | $98,733 | $73,000 | 245,115 | - |
| 41 | Aurora, CO | $90,092 | $66,000 | 361,710 | - |
| 42 | Oakland, CA | $106,119 | $77,000 | 420,005 | - |
| 43 | Chesapeake, VA | $98,628 | $73,000 | 237,940 | - |
| 44 | Fremont, CA | $106,022 | $77,000 | 233,136 | - |
| 45 | San Jose, CA | $105,950 | $77,000 | 1,025,350 | - |
| 46 | Cincinnati, OH | $81,319 | $61,000 | 298,800 | - |
| 47 | Stockton, CA | $105,865 | $77,000 | 307,072 | - |
| 48 | Albuquerque, NM | $85,593 | $63,000 | 559,277 | - |
| 49 | Sacramento, CA | $105,808 | $77,000 | 495,234 | - |
| 50 | Colorado Springs, CO | $90,635 | $67,000 | 465,101 | - |
Highest paying cities for process/product engineers
| Rank | City | Avg. process/product engineer salary |
|---|---|---|
| 1 | Fremont, CA | $106,022 |
| 2 | Natick, MA | $98,884 |
| 3 | Warren, MI | $91,879 |
| 4 | Austin, TX | $90,707 |
| 5 | Atlanta, GA | $90,109 |
| 6 | Corvallis, OR | $87,585 |
| 7 | Saint Louis, MO | $77,389 |
| 8 | Granite City, IL | $75,168 |
| 9 | De Pere, WI | $68,335 |
| 10 | Bloomington, IN | $67,126 |