The best job markets boast low unemployment rates, high wage growth, and overall happiness among workers in the area.
The worst job markets? Picture the exact opposite.
We already checked out the best job markets of 2018. Now we’re looking at the worst.
These areas have the bleakest outlook on employment of anywhere in the country. The employment situation may be great throughout the country, but not in these areas.
If you’re a new grad looking for work or someone in their mid-career searching for a change, you’re not going to find what you’re looking for here.
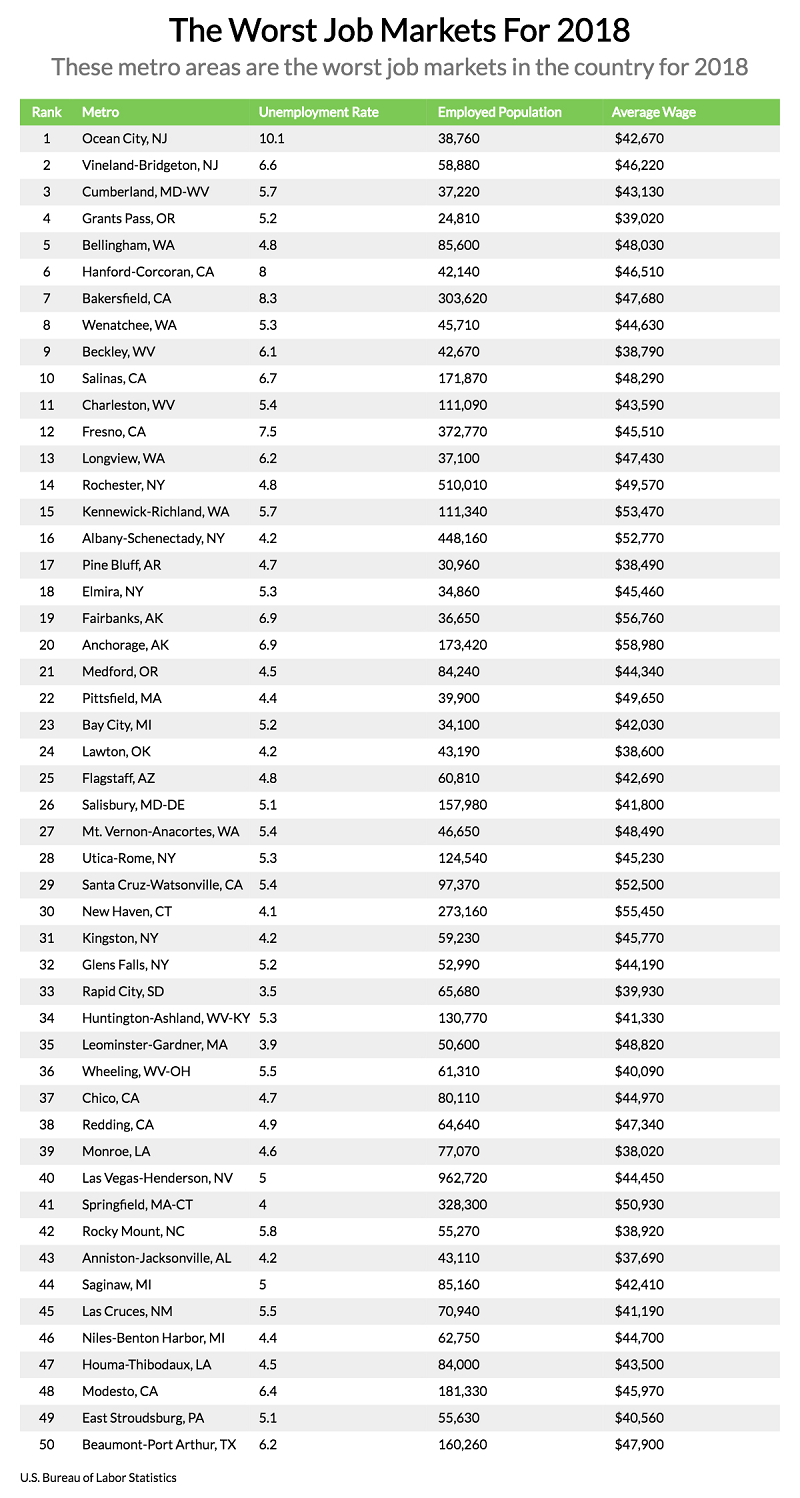
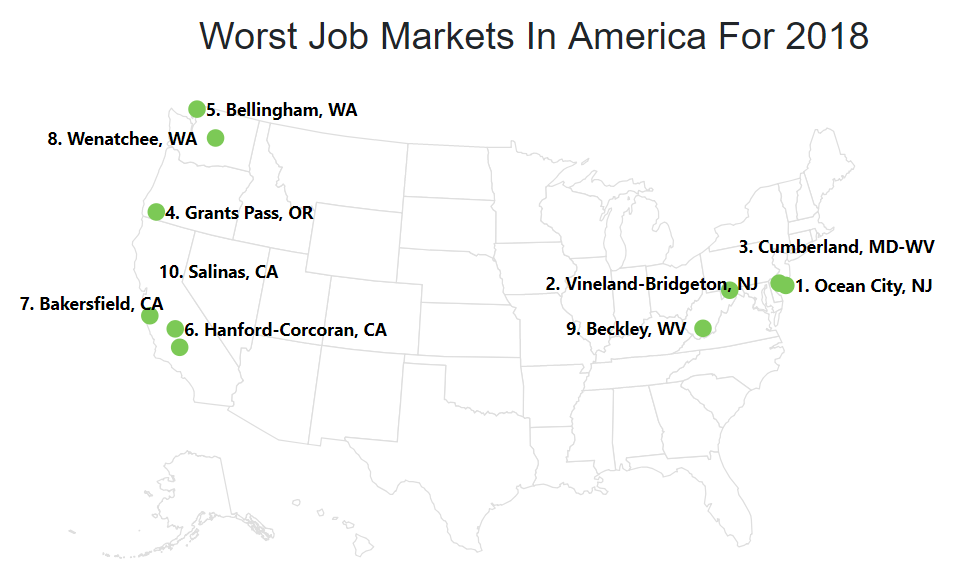
These are the 10 worst job markets for 2018:
- Ocean City, NJ
- Vineland-Bridgeton, NJ
- Cumberland, MD-WV
- Grants Pass, OR
- Bellingham, WA
- Hanford-Corcoran, CA
- Bakersfield, CA
- Wenatchee, WA
- Beckley, WV
- Salinas, CA
Only five states comprise the bottom 10 job markets for 2018. It’d be easy to dismiss these states as bad for employment as whole, but each has strong job markets throughout their area, too.
Just goes to show that the strength of job markets varies, not only by state, but by metro area, as well.
How we determined the worst job markets in the US for 2018
Looking at 386 different metro areas, we ranked each 1 to 386 in three categories - wage change, unemployment rate change, and current unemployment rate - one being best, 386 being the worst.
The average of the three numbers was then used to produce a final ranking of each metro area. The lower number the average, the better job market.
For this study, we focused on the higher numbered averages - those metro areas that had the highest unemployment rate and wage decreases. These areas are the worst job markets in America for 2018.
Read on for a closer look at the bottom 10 metros, then a list of the bottom 50 at the end.
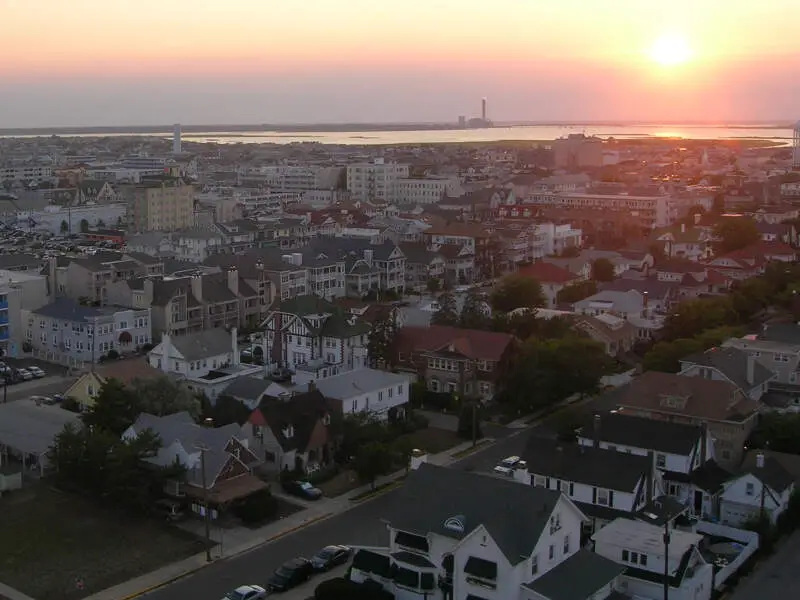
1. Ocean City, NJ
Employed population: 38,760
Unemployment rate: 10.1%
Annual mean wage: $42,670
Ocean City is a fun vacation spot, not so much for jobs.
Not exactly a ringing endorsement for the state’s employment situation.
With an unemployment rate of 10% and a year-over-year average wage drop of just over 4%, Ocean City is great for a trip, but not to settle down in.
2. Vineland-Bridgeton, NJ
Employed population: 58,880
Unemployment rate: 6.6%
Annual mean wage: $46,220
Vineland-Bridgeton has some gorgeous scenic views and trails to check out if your an outdoorsman. If you’re looking for employment, look anywhere else in the state.
There aren’t a lot of big employers in the Vineland-Bridgeton area.
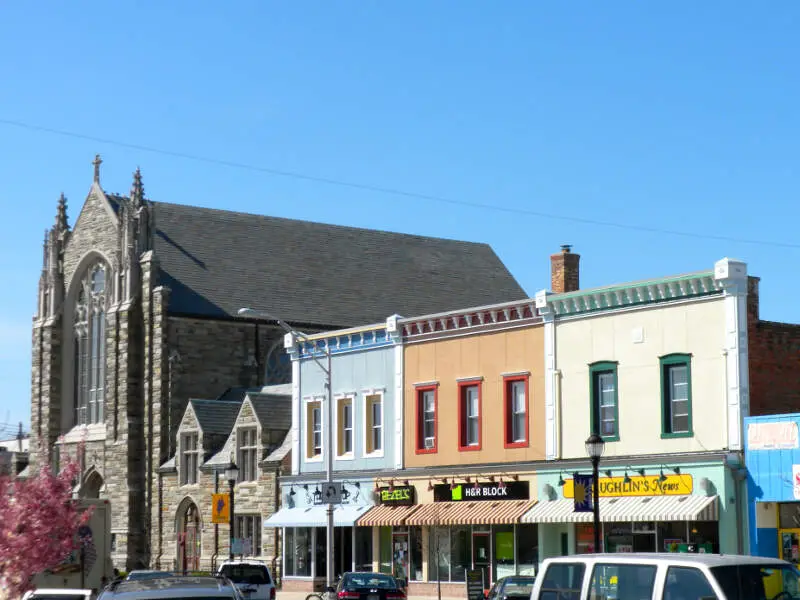
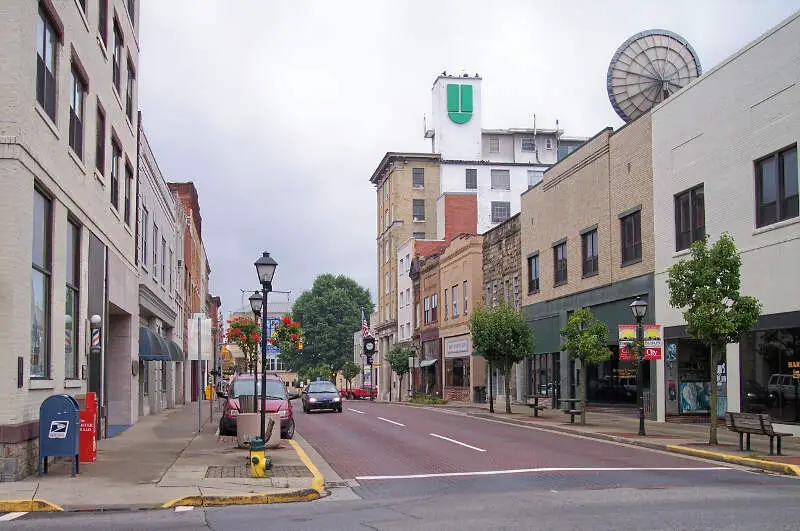
3. Cumberland, MD-WV

Employed population: 37,220
Unemployment rate: 5.7%
Annual mean wage: $43,130
No, that’s not a typo. The unemployment rate of Yuma stands at 5.7%. Not ideal.
4. Grants Pass, OR

Employed population: 24,810
Unemployment rate: 5.2%
Annual mean wage: $39,020
If you’re a college kid looking to have a good time? Grants Pass is the place for you.
If you’re looking for a stable job and good income? Best stay away.
With Grants Pass's annual mean wage increasing only by .33% over the last year, it’s just best if recent grads from the school try and find work somewhere else.
5. Bellingham, WA
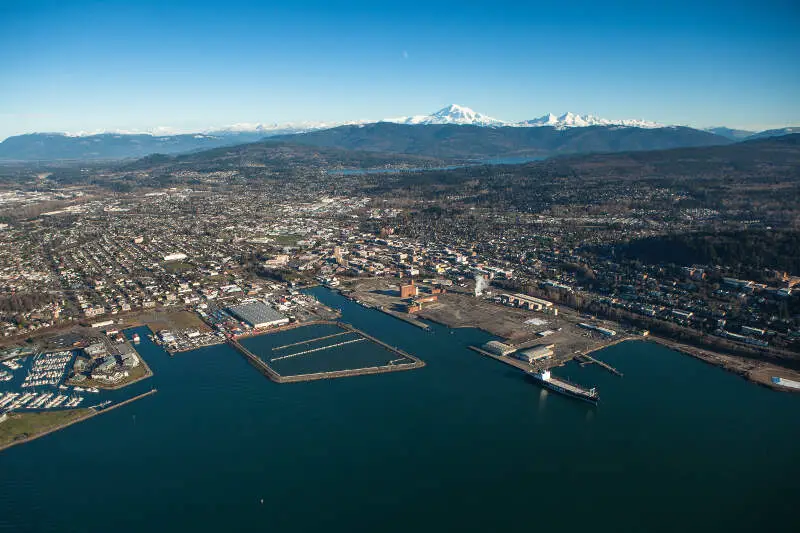
Employed population: 85,600
Unemployment rate: 4.8%
Annual mean wage: $48,030
Bellingham was a force to be reckoned with in the 19th century, with the city being a major industrial player.
Now the area isn’t exactly a hotspot for people looking for work.
6. Hanford-Corcoran, CA
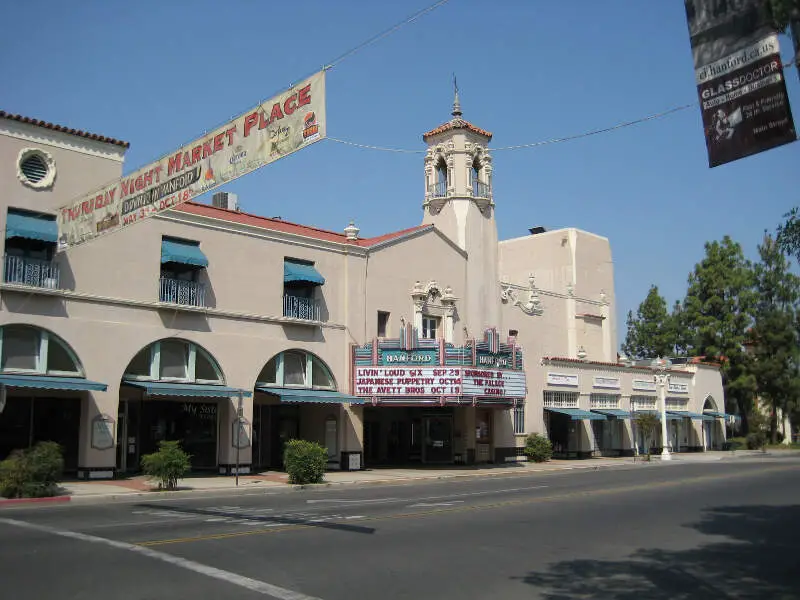
Employed population: 42,140
Unemployment rate: 8%
Annual mean wage: $46,510
The cities in California don’t offer a wide variety of employment opportunities for those looking to settle in the Golden State.
The unemployment rate hasn’t changed since 2017, standing at 8%.
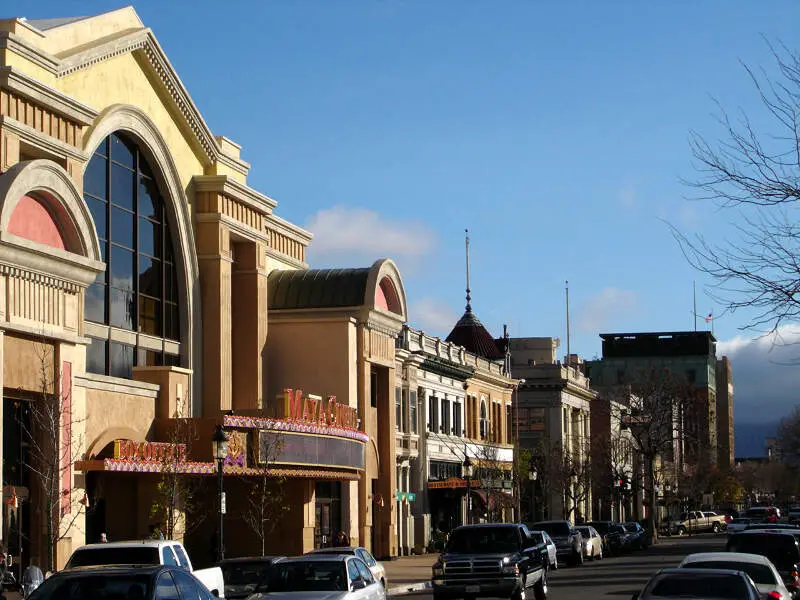
7. Bakersfield, CA
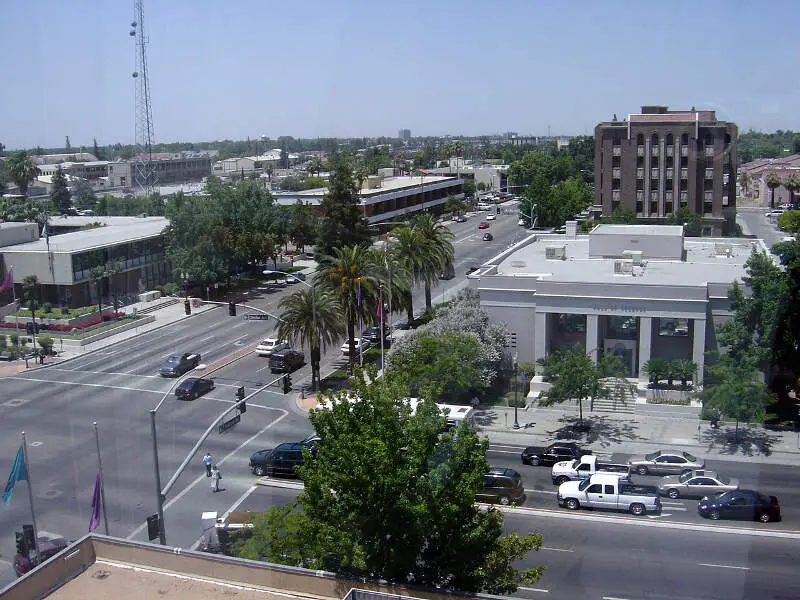
Employed population: 303,620
Unemployment rate: 8.3%
Annual mean wage: $47,680
By far the largest metro area in our top 10, the Bakersfield area still doesn’t serve as a great resource for job seekers.
Wage change in the area has only increased .57% over the last year.
8. Wenatchee, WA
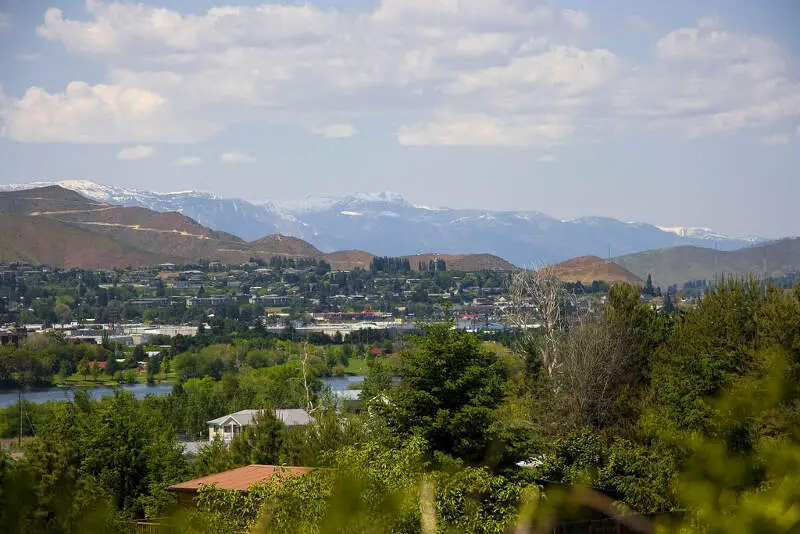
Employed population: 45,710
Unemployment rate: 5.3%
Annual mean wage: $44,630
Located only three hours from Olympia, Wenatchee continues our trend of areas with beautiful scenery, but not so great jobs.
The area also has seen it’s unemployment rate decrease over the last year, but has also seen its average wage hasn't changed at all.
9. Beckley, WV
Employed population: 42,670
Unemployment rate: 6.1%
Annual mean wage: $38,790
Year-over-year wages have been stagnant, like most every other city on this list.
10. Salinas, CA
Employed population: 171,870
Unemployment rate: 6.7%
Annual mean wage: $48,290
Rounding out our bottom 10, Salinas also has one of the worst unemployment rates in the country.
The area has come a long way since the early 2010s when its unemployment rate was much higher.
These are the 10 worst job markets in America for 2018
No offense to anyone from or working in these areas, we’re just following the data.
For a list of the worst 50 job markets in America, check out this table below: