Find a Job You Really Want In
Do you love your job but dread the daily commute? You’re not alone—many Americans share this sentiment.
While fulfilling careers await on the other side of the road, long hours spent commuting can lead to job dissatisfaction. Moreover, navigating through unpredictable traffic and hazardous driving conditions can make your journey to work feel daunting.
So, how safe is your commute in 2026?
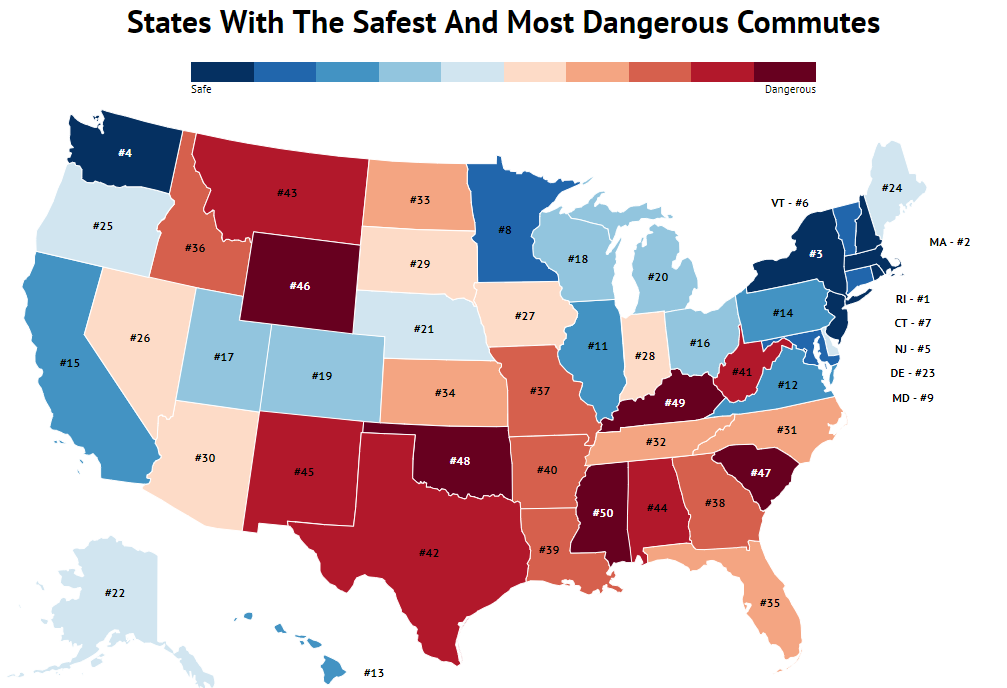
Fortunately, Zippia is here to provide insights into the states with the safest and most hazardous commutes. Let’s explore how your commute measures up!
5 Safest States for Commuters
5 Most Dangerous States for Commuters
Surprised to see Rhode Island at the top? Slower speeds and a higher usage of public transport might contribute to its ranking as the safest state for commuting.
Conversely, Mississippi ranks as the most dangerous state for drivers, presenting unique challenges for its residents.
Curious about the data behind these rankings? Read on for a deeper dive into the states’ safety records.
How We Determined State Safety for Drivers
To compile our list of the safest and most dangerous states for commuting, we analyzed the fatality rate per 100,000 licensed drivers using data from the National Highway Traffic Safety Administration (NHTSA) from 2023.
Using this data, we ranked the safest states by the lowest fatality rates and the most dangerous by the highest rates. This method normalizes population differences across states, providing a clearer picture of driver safety.
5 Safest States
1. Rhode Island

Population: 1,056,000
Fatalities Per 100k Licensed Drivers: 6.77
Rhode Island boasts the best commute safety with a low fatality rate of just 6.77 deaths per 100,000 licensed drivers. This could be attributed to the state’s compact size and stringent distracted driving laws.
2. Massachusetts

Population: 6,812,000
Fatalities Per 100k Licensed Drivers: 7.72
Massachusetts ranks second with a commendable fatality rate of 7.72. The state’s comprehensive road safety measures and public awareness campaigns play a significant role in keeping drivers safe.
3. New York

Population: 19,745,000
Fatalities Per 100k Licensed Drivers: 8.58
New York, known for its bustling cities and extensive public transit, ranks third with a fatality rate of 8.58. In urban areas, pedestrian safety remains a priority, reflecting the need for comprehensive traffic safety measures.
4. Washington

Population: 7,288,000
Fatalities Per 100k Licensed Drivers: 9.53
Washington ranks fourth with a fatality rate of 9.53. Recent laws prohibiting distractions while driving contribute to its safety record.
5. New Jersey

Population: 8,944,000
Fatalities Per 100k Licensed Drivers: 9.63
New Jersey rounds out the top five with a fatality rate of 9.63 per 100,000 drivers, reflecting proactive measures to enhance road safety.
5 Most Dangerous States
1. Mississippi

Population: 2,989,000
Fatalities Per 100k Licensed Drivers: 34.18
Mississippi tops the list as the most dangerous state for drivers, with a fatality rate of 34.18 per 100,000 drivers. Despite some improvements, factors like inadequate enforcement of DUI laws contribute to its high rates.
2. Kentucky

Population: 4,437,000
Fatalities Per 100k Licensed Drivers: 27.51
Kentucky ranks second with a fatality rate of 27.51. While some laws permit talking while driving, distracted driving remains a concern.
3. Oklahoma

Population: 3,924,000
Fatalities Per 100k Licensed Drivers: 27.34
Oklahoma follows closely with a fatality rate of 27.34, influenced by similar distracted driving laws as Kentucky.
4. South Carolina

Population: 4,961,000
Fatalities Per 100k Licensed Drivers: 27.09
South Carolina’s fatality rate of 27.09 is compounded by a high percentage of alcohol-related accidents.
5. Wyoming

Population: 586,000
Fatalities Per 100k Licensed Drivers: 26.6
Wyoming closes our list with a fatality rate of 26.6. Notably, a significant number of drivers involved in accidents were not wearing seatbelts, highlighting a critical safety issue.
Conclusion
In summary, these rankings highlight the safest and most hazardous states for commuting in the U.S. With nearly 38,000 hours spent driving throughout a lifetime, according to studies, it’s essential to prioritize road safety for yourself and others.
| State | Fatalities Per 100k Licensed Drivers |
|---|---|
| Rhode Island | 6.77 |
| Massachusetts | 7.72 |
| New York | 8.58 |
| Washington | 9.53 |
| New Jersey | 9.63 |
| Vermont | 11.2 |
| Connecticut | 11.22 |
| Minnesota | 11.6 |
| Maryland | 11.84 |
| Illinois | 12.71 |
| Virginia | 12.86 |
| Hawaii | 12.88 |
| Pennsylvania | 13.2 |
| California | 13.83 |
| Ohio | 14.19 |
| Utah | 14.33 |
| Wisconsin | 14.43 |
| Colorado | 14.95 |
| Michigan | 15.04 |
| Nebraska | 15.52 |
| Alaska | 15.71 |
| Delaware | 15.73 |
| Maine | 15.76 |
| Oregon | 17.33 |
| Nevada | 17.52 |
| Iowa | 17.99 |
| Indiana | 18.03 |
| South Dakota | 18.63 |
| Arizona | 18.93 |
| North Carolina | 19.95 |
| Tennessee | 20.03 |
| North Dakota | 20.33 |
| Kansas | 21.13 |
| Florida | 21.63 |
| Idaho | 21.79 |
| Missouri | 22.24 |
| Georgia | 22.28 |
| Louisiana | 22.3 |
| Arkansas | 22.79 |
| West Virginia | 23.2 |
| Texas | 23.78 |
| Montana | 23.84 |
| Alabama | 26.32 |
| New Mexico | 26.42 |
| Wyoming | 26.6 |
| South Carolina | 27.09 |
| Oklahoma | 27.34 |
| Kentucky | 27.51 |
| Mississippi | 34.18 |
Author
Heidi Cope is a former writer for the Zippia Career Advice blog. Her writing focused primarily on Zippia's suite of rankings and general career advice. After leaving Zippia, Heidi joined The Mighty as a writer and editor, among other positions. She received her BS from UNC Charlotte in German Studies.


