Find a Job You Really Want In
While the phrase “Ok boomer” continues to circulate, many baby boomers are grappling with significant challenges as they navigate retirement and aging.
In recent years, discussions around economic hardship have largely focused on millennials; however, baby boomers also face their share of difficulties. As they enter or surpass retirement age, the financial realities can be daunting. Despite spending less on trendy items, the costs associated with aging can be considerable. A significant portion of individuals aged 55 to 75 are experiencing financial instability, and the challenges they face vary greatly depending on geographic location. To shed light on this issue, we analyzed all 50 states to reveal where baby boomers are struggling the most.
In this article, we will outline the criteria used to evaluate the states and present the full ranked list. But first, let’s take a look at the 10 states where baby boomers face the greatest difficulties.
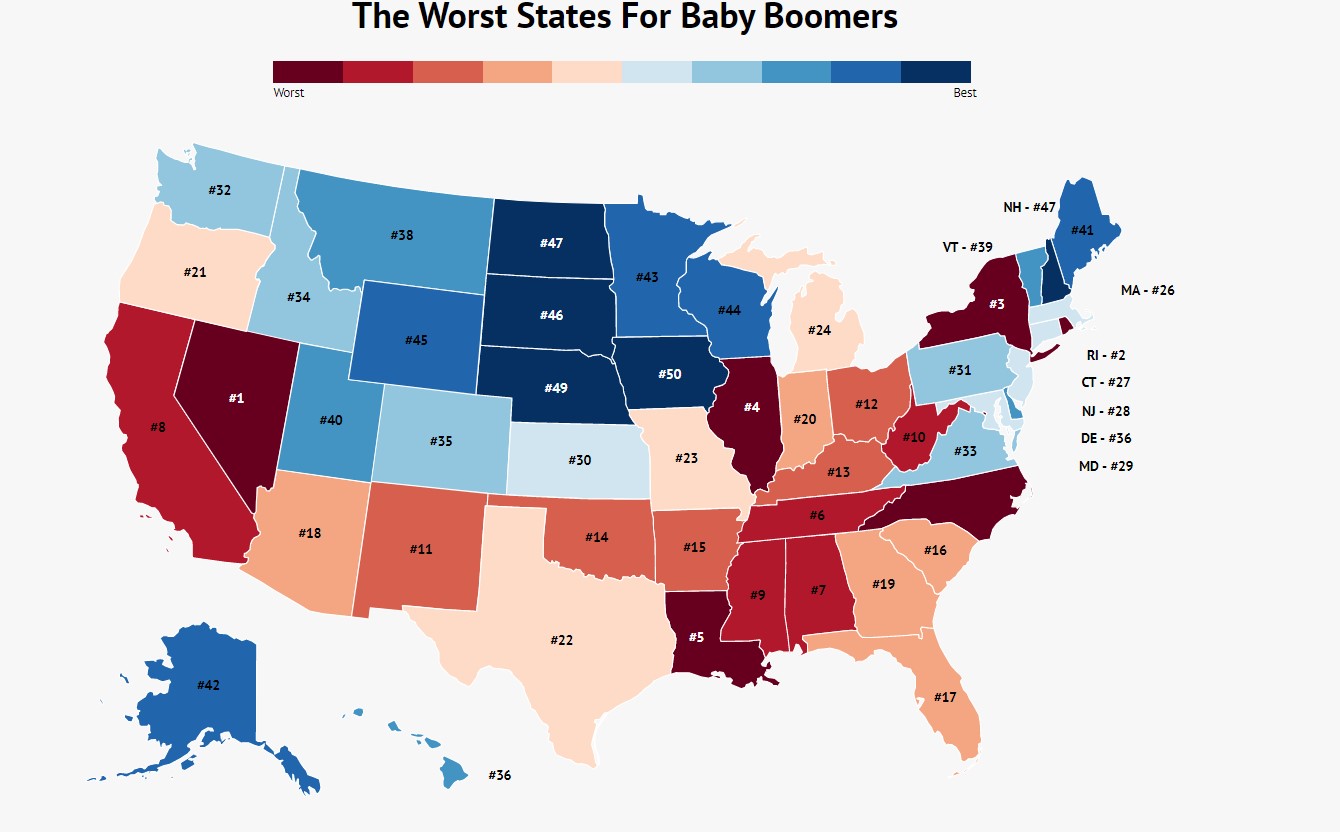
Here are the 10 worst states for baby boomers in 2026
- Nevada
- Rhode Island
- New York
- Illinois
- Louisiana
- Tennessee
- Alabama
- California
- Mississippi
- West Virginia
Though baby boomers may consider relocating for lower living costs and better climates, careful consideration is essential. Notably, five of the states on this list are located in the southern region, where high living costs and inadequate wellness resources contribute to the struggles faced by older adults.
Continue reading to discover why these states present the most challenges for baby boomers and to view the complete list.
How We Determined The Worst States For Baby Boomers
Each state was evaluated and ranked 1 to 50 across five key metrics:
- Average Retirement Savings
- State Well-Being
- Baby Boomer Unemployment Rate
- Percentage of Baby Boomers with Mortgages
- Percentage of Baby Boomers Living in Poverty
We calculated the average score across these categories, giving equal weight to each. A higher score in a category leads to a lower rank. For instance, Rhode Island’s baby boomers have a 4.3% unemployment rate, the second highest nationally, resulting in a #2 rank for unemployment.
Data was sourced from the latest American Community Survey and other reputable sources to ensure accuracy in analyzing the unemployment rates, poverty levels, and mortgage statistics for individuals aged 55 to 64. We also utilized the Gallup Health and Well-Being Report to assess wellness metrics, which are increasingly vital as baby boomers age.
For insights into retirement savings, we referenced data from Personal Capital to gather relevant statistics.
If your state isn’t listed among the top 10, check the bottom section of the article for its ranking. Let’s delve deeper into why these states are the least favorable for baby boomers.
1. Nevada
Unemployment: 4.2%
Mortgages: 60%
Poverty Rate: 10%
Retirement Savings: $183,946
State Well-Being: 19
Nevada ranks as the worst state for baby boomers. Many in this demographic may not wish to work and look forward to retirement, but those who lose their jobs in Nevada find it particularly challenging to secure new employment. Coupled with inadequate retirement savings and a high poverty rate, many older adults in Nevada remain burdened by mortgages.
2. Rhode Island

Unemployment: 4.3%
Mortgages: 63%
Poverty Rate: 9%
Retirement Savings: $202,862
State Well-Being: 25
It’s not easy being a baby boomer in Rhode Island. Nearly 10% of this demographic lives in poverty, complicating retirement for the approximately 50% who carry a mortgage.
3. New York
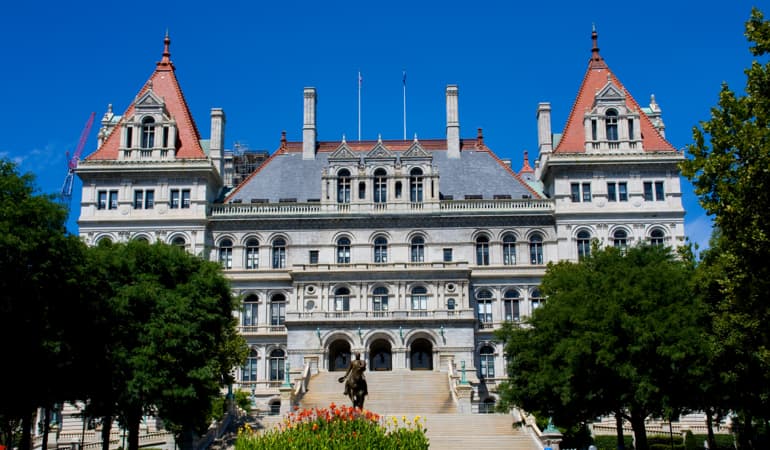
Unemployment: 3.6%
Mortgages: 52%
Poverty Rate: 11%
Retirement Savings: $207,889
State Well-Being: 37
New York, New York may be iconic, but for baby boomers, it presents unique challenges. A low well-being rate indicates that many New Yorkers are dissatisfied with their careers and living conditions.
4. Illinois

Unemployment: 4.1%
Mortgages: 54%
Poverty Rate: 9%
Retirement Savings: $223,238
State Well-Being: 42
While Illinois baby boomers may have slightly higher retirement savings than those in New York, the overall conditions remain challenging.
5. Louisiana

Unemployment: 3.5%
Mortgages: 41%
Poverty Rate: 13%
Retirement Savings: $198,337
State Well-Being: 43
Louisiana, known for its vibrant culture, ranks as the fifth worst state for baby boomers due to a high poverty rate and lower well-being scores.
6. Tennessee

Unemployment: 3.0%
Mortgages: 48%
Poverty Rate: 10%
Retirement Savings: $188,818
State Well-Being: 46
Tennessee’s baby boomers face significant challenges, with 10% living in poverty and overall low well-being among the remaining population.
7. Alabama

Unemployment: 2.8%
Mortgages: 48%
Poverty Rate: 12%
Retirement Savings: $191,599
State Well-Being: 44
Despite lower unemployment and mortgage rates, Alabama’s high poverty levels and low well-being ratings contribute to a challenging environment for baby boomers.
8. California
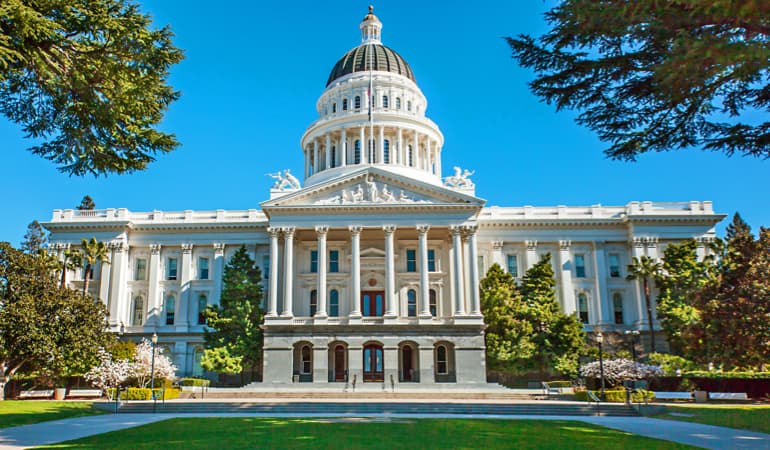
Unemployment: 3.9%
Mortgages: 66%
Poverty Rate: 10%
Retirement Savings: $227,290
State Well-Being: 14
Californians often enjoy a high quality of life, but for baby boomers, rising housing costs and mortgage burdens can be overwhelming.
9. Mississippi

Unemployment: 2.9%
Mortgages: 39%
Poverty Rate: 14%
Retirement Savings: $201,989
State Well-Being: 47
Mississippi mirrors Alabama’s struggles, with low mortgage rates failing to offset the high poverty rate and poor well-being metrics.
10. West Virginia
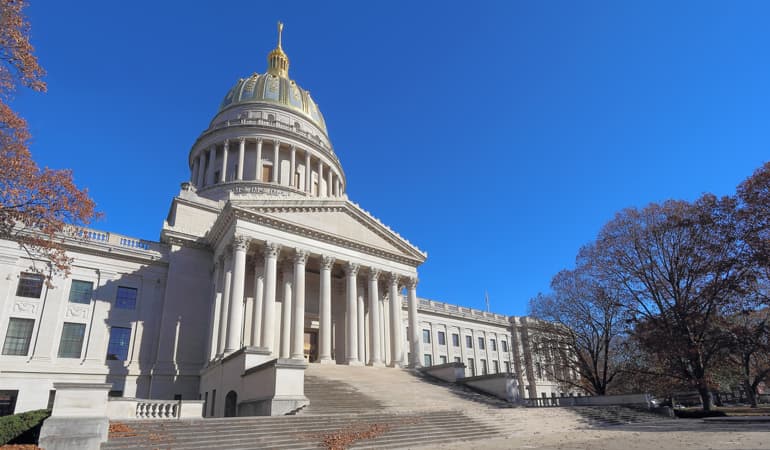
Unemployment: 3.2%
Mortgages: 38%
Poverty Rate: 12%
Retirement Savings: $211,086
State Well-Being: 50
West Virginia completes the list, with its baby boomers experiencing a combination of high poverty and low well-being, making retirement challenging.
Summary On The Worst States To Be A Baby Boomer
In summary, these 10 states represent the most difficult environments for baby boomers, with southern states featuring prominently due to high poverty levels and low well-being indicators. Additionally, states with high living costs, such as California and New York, also pose significant challenges. Interestingly, there is notable overlap between the struggles faced by baby boomers and millennials, suggesting that both generations may share common ground in their economic hardships.
See Where Your State Fell On The List:
| State | Well-Being (1=Best) | Poverty Rate | % With Mortgage | Unemployment Rate | Retirement Savings |
|---|---|---|---|---|---|
| Nevada | 19 | 10% | 60% | 4.2 | $183,946 |
| Rhode Island | 25 | 9% | 63% | 4.3 | $202,862 |
| New York | 37 | 11% | 52% | 3.6 | $207,889 |
| Illinois | 42 | 9% | 54% | 4.1 | $223,238 |
| Louisiana | 43 | 13% | 41% | 3.5 | $198,337 |
| Tennessee | 46 | 10% | 48% | 3.0 | $188,818 |
| Alabama | 44 | 12% | 48% | 2.8 | $191,599 |
| California | 14 | 10% | 66% | 3.9 | $227,290 |
| Mississippi | 47 | 14% | 39% | 2.9 | $201,989 |
| West Virginia | 50 | 12% | 38% | 3.2 | $211,086 |
| New Mexico | 30 | 15% | 47% | 4.0 | $226,143 |
| Ohio | 38 | 9% | 55% | 3.0 | $222,700 |
| Kentucky | 48 | 12% | 48% | 2.0 | $217,860 |
| Oklahoma | 45 | 10% | 44% | 2.0 | $158,139 |
| Arkansas | 49 | 12% | 44% | 2.0 | $206,539 |
| South Carolina | 39 | 11% | 51% | 3.0 | $229,192 |
| Florida | 20 | 11% | 51% | 3.0 | $217,839 |
| Arizona | 15 | 9% | 57% | 3.0 | $226,584 |
| Georgia | 23 | 11% | 57% | 2.0 | $223,713 |
| Indiana | 41 | 8% | 57% | 2.0 | $212,908 |
| Oregon | 28 | 9% | 58% | 3.0 | $237,771 |
| Texas | 29 | 11% | 45% | 3.0 | $220,480 |
| Missouri | 40 | 9% | 52% | 2.0 | $213,408 |
| Michigan | 33 | 10% | 52% | 3.0 | $241,395 |
| North Carolina | 36 | 9% | 55% | 2.0 | $241,808 |
| Massachusetts | 17 | 8% | 61% | 3.0 | $241,143 |
| Connecticut | 16 | 8% | 61% | 4.0 | $279,367 |
| New Jersey | 31 | 7% | 61% | 3.0 | $272,919 |
| Maryland | 32 | 7% | 67% | 3.0 | $244,690 |
| Kansas | 35 | 8% | 49% | 2.0 | $202,358 |
| Pennsylvania | 34 | 8% | 51% | 3.0 | $237,754 |
| Washington | 13 | 7% | 60% | 2.0 | $209,783 |
| Virginia | 27 | 8% | 61% | 2.0 | $240,199 |
| Idaho | 22 | 8% | 54% | 2.0 | $199,877 |
| Colorado | 6 | 8% | 61% | 2.0 | $213,406 |
| Delaware | 8 | 9% | 56% | 3.0 | $286,277 |
| Hawaii | 1 | 7% | 62% | 2.0 | $180,361 |
| Montana | 4 | 9% | 47% | 2.0 | $168,755 |
| Vermont | 7 | 9% | 54% | 2.0 | $233,448 |
| Utah | 5 | 6% | 56% | 2.0 | $183,925 |
| Maine | 21 | 9% | 52% | 2.0 | $228,713 |
| Alaska | 3 | 8% | 50% | 4.0 | $271,197 |
| Minnesota | 12 | 8% | 54% | 2.0 | $234,106 |
| Wisconsin | 24 | 7% | 53% | 2.0 | $227,382 |
| Wyoming | 2 | 8% | 47% | 2.0 | $153,182 |
| South Dakota | 9 | 7% | 41% | 1.0 | $183,225 |
| North Dakota | 10 | 7% | 37% | 2.0 | $178,005 |
| New Hampshire | 11 | 6% | 55% | 2.0 | $264,624 |
| Nebraska | 18 | 7% | 47% | 2.0 | $233,910 |
| Iowa | 26 | 7% | 48% | 1.0 | $245,071 |
For the latest insights and engaging stories, subscribe to our newsletter by reaching out to Kathy Morris at kmorris@zippia.com.
Author
Kathy is the head of content at Zippia with a knack for engaging audiences. Prior to joining Zippia, Kathy worked at Gateway Blend growing audiences across diverse brands. She graduated from Troy University with a degree in Social Science Education.