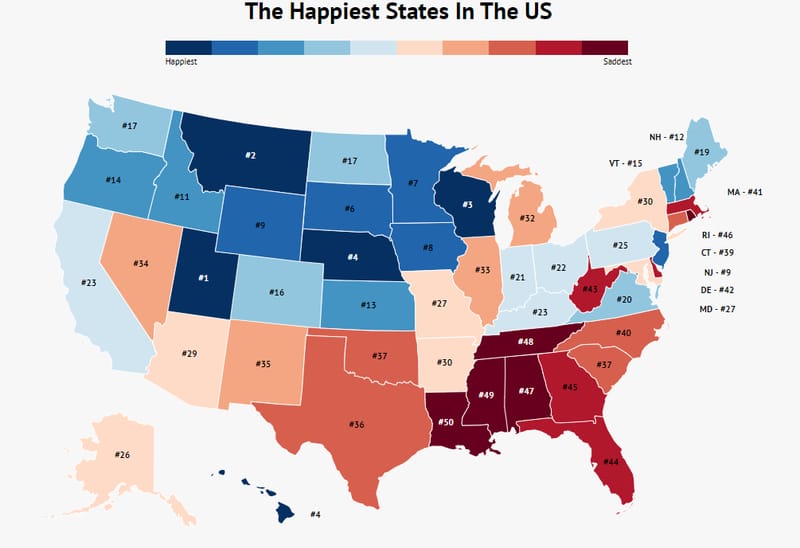
The happiest state in the U.S. is Utah, with the highest marriage rate of 57.2 and an impressive average annual income of $71,414.
The least happy state in the U.S. is Louisiana, with a low average annual income of $47,905.
People who are married are 8.8% more likely to be happy.
Only 14% of Americans say they’re “very happy”, while 79% believe more money would make them happier.
Ever wonder where in the US people are the happiest?
Just like where you work and what you do, where you live can have major implications for your quality of live. We set out to find the states where life is sweetest and the residents have the most to grin about. We found the states where people are working (but not working too much), in stable relationships, and aren’t just scraping by.
The results? Happiness is contagious, with some stretches of the company being a lot happier than others.
How We Determined The Happiest States
There are a lot of factors that contribute to happiness. Some of them are pretty intangible. Yet, external forces can strongly impact your state of mind. For example, while money can’t buy happiness, it is hard to be happy when you’re worried about where your next meal is going to come from. Spending 45 minutes on the interstate every day screaming at your fellow drivers to use their turn signals may not make you profoundly miserable, but it certainly isn’t improving your life. With that in mind, we examined the aspects of life that are evidence of unhappiness and that directly contribute to happiness.
We ranked all 50 states equally on:
- Depression Rates (The less depression, the happier the state)
- Household Income (More is happier)
- Unemployment (Less is happier)
- Commute length (Shorter is happier)
- Hours Worked (Less is happier)
- Marriage Rate (More is happier)
While some may be confused to see marriage rates included in our metrics, studies show that married people are typically happier than unmarried people. However, it is worth noting that marriage doesn’t cause happiness. In fact, people leaving a bad marriage experience spikes of happiness. However, a happy marriage and positive social interactions are important for mood and mental health.
With the exception of depression rates, all other data came from the Census’ American Community Survey. The depression rates came from Blue Cross’s executive summary on depression in the nation.
1. Utah

Depression Rate: 6
Median Household Income: $71,414
Commute: 21.7 minutes
Marriage Rate: 57.2
Utah is the happiest state in the US by a good bit. Utah residents work less than 40 hours a week on average and come home from short commutes to their loving partner. Toss in a higher than average median household income and you have a recipe for happiness.
2. Montana

Depression Rate: 4.7
Median Household Income: $55,328
Commute: 18 minutes
Marriage Rate: 53.1
Montana is the second happiest state in the nation. Montanans work under 40 hours a week on average and aren’t burdened with long commutes. That work-life-balance gives them plenty of time to enjoy with the spouse most of them come home to.
3. Wisconsin

Depression Rate: 4.4
Median Household Income: $60,773
Commute: 22 minutes
Marriage Rate: 51.7
Wisconsinites are pretty happy. High marriage rates, low unemployment, and less depression than most other states give them a lot of reasons to be happy.
4. Nebraska

Depression Rate: 4.1
Median Household Income: $59,566
Commute: 18.6 minutes
Marriage Rate: 54.2
Nebraska is the 4th happiest state. Nebraskans waste less of their time coming home from work than most other states. Which is good news because with super low unemployment, most of them are working.
5. Hawaii

Depression Rate: 2.1
Median Household Income: $80,212
Commute: 27.4
Marriage Rate: 50.7
Want to be happy? Try living the island life. Hawaiians have the lowest depression rates in the nation. While we didn’t take weather into account in our survey, we can’t help but think living in a tropical paradise must help a little.
6. South Dakota

Depression Rate: 4.1
Median Household Income: $56,274
Commute: 17
Marriage Rate: 53.2
South Dakota residents enjoy some of the lowest unemployment in the nation. That’s something to smile about.
7. Minnesota

Depression Rate: 5.8
Median Household Income: $70,315
Commute: 23.5
Marriage Rate: 52.7
Minnesota is the 7th happiest state in the nation. The “Land of 10,000 Lakes” is also the land of good work-life balance, high household incomes, and low unemployment. But I don’t think that will fit on a license plate.
8. Iowa

Depression Rate: 4.9
Median Household Income: $59,955
Commute: 19.1
Marriage Rate: 52.9
Iowa is one happy Midwestern state. For one, they have pretty short commutes- on average 19.1 minutes, which is 7 minutes shorter than the average US commute. If that 7 minutes don’t make you happy, consider that’s 14 minutes a day both ways, and more than an hour saved each week. Over a year that adds up to 52 hours saved.
9. Wyoming

Depression Rate: 4.7
Median Household Income: $61,584
Commute: 17.8
Marriage Rate: 53.3
Wyoming is the 9th happiest state in the US. High marriage rates and short commutes help keep people feeling positive.
10. New Jersey

Depression Rate: 3.6
Median Household Income: $81,740
Commute: 31.7
Marriage Rate: 53
New Jersey may be experiencing a decrease in population, but residents who stay have some pretty strong factors in there favor. One big plus? New Jersey residents have some of the lowest depression rates in the nation and healthy median household income. Long commutes keep New Jersey residents from being happier.
Summary On The Happiest States
These are the 10 happiest states in the nation. While we can’t guarantee that everyone in these states is grinning cheek to cheek, the odds are stacked in their favor. New Jersey residents have lower than average depression rates and pull in healthy salary. Long commutes keeps New Jersey residents from being happier on the list.
Midwestern states sweeped the top 10, with low unemployment, short commutes, and relatively high household incomes making Midwestern residents pretty content.
Where are the least happiest states?
You can see the full data below.
All States, From Happiest To Least Happy
| Rank | State | Depression Rate | Household Income | Commute (Minutes) | Marriage Rate | Unemployment | Hours Worked |
|---|---|---|---|---|---|---|---|
| 1 | Utah | 6 | 71,414 | 21 | 57 | 2 | 37 |
| 2 | Montana | 4 | 55,328 | 18 | 53 | 2 | 38 |
| 3 | Wisconsin | 4 | 60,773 | 22 | 51 | 2 | 38 |
| 4 | Nebraska | 4 | 59,566 | 18 | 54 | 2 | 39 |
| 4 | Hawaii | 2 | 80,212 | 27 | 50 | 2 | 38 |
| 6 | South Dakota | 4 | 56,274 | 17 | 53 | 2 | 39 |
| 7 | Minnesota | 5 | 70,315 | 23 | 52 | 2 | 38 |
| 8 | Iowa | 4 | 59,955 | 19 | 52 | 2 | 38 |
| 9 | Wyoming | 4 | 61,584 | 17 | 53 | 2 | 40 |
| 9 | New Jersey | 3 | 81,740 | 31 | 53 | 3 | 38 |
| 11 | Idaho | 5 | 55,583 | 20 | 55 | 2 | 38 |
| 12 | New Hampshire | 5 | 74,991 | 27 | 52 | 2 | 38 |
| 13 | Kansas | 4 | 58,218 | 19 | 53 | 2 | 39 |
| 14 | Oregon | 5 | 63,426 | 23 | 51 | 3 | 37 |
| 15 | Vermont | 5 | 60,782 | 22 | 49 | 2 | 37 |
| 16 | Colorado | 4 | 71,953 | 25 | 51 | 2 | 39 |
| 17 | Washington | 4 | 74,073 | 27 | 52 | 2 | 38 |
| 17 | North Dakota | 5 | 63,837 | 17 | 50 | 1 | 40 |
| 19 | Maine | 6 | 55,602 | 24 | 51 | 2 | 38 |
| 20 | Virginia | 4 | 72,577 | 28 | 51 | 2 | 39 |
| 21 | Indiana | 4 | 55,746 | 23 | 50 | 2 | 39 |
| 22 | Ohio | 4 | 56,111 | 23 | 49 | 3 | 38 |
| 23 | Kentucky | 4 | 50,247 | 23 | 51 | 3 | 38 |
| 23 | California | 3 | 75,277 | 29 | 48 | 3 | 38 |
| 25 | Pennsylvania | 4 | 60,905 | 26 | 50 | 3 | 38 |
| 26 | Alaska | 3 | 74,346 | 18 | 50 | 4 | 41 |
| 27 | Missouri | 5 | 54,478 | 23 | 51 | 2 | 38 |
| 27 | Maryland | 4 | 83,242 | 32 | 50 | 3 | 38 |
| 29 | Arizona | 3 | 59,246 | 25 | 48 | 3 | 38 |
| 30 | Arkansas | 4 | 47,062 | 21 | 51 | 2 | 39 |
| 30 | New York | 4 | 67,844 | 33 | 48 | 3 | 38 |
| 32 | Michigan | 4 | 56,697 | 24 | 49 | 3 | 38 |
| 33 | Illinois | 4 | 65,030 | 29 | 50 | 3 | 38 |
| 34 | Nevada | 3 | 58,646 | 24 | 46 | 3 | 38 |
| 35 | New Mexico | 4 | 47,169 | 22 | 46 | 3 | 38 |
| 36 | Texas | 3 | 60,629 | 26 | 50 | 3 | 40 |
| 37 | Oklahoma | 5 | 51,924 | 21 | 51 | 2 | 39 |
| 37 | South Carolina | 3 | 52,306 | 24 | 49 | 3 | 39 |
| 39 | Connecticut | 5 | 76,348 | 26 | 49 | 3 | 38 |
| 40 | North Carolina | 4 | 53,855 | 24 | 51 | 3 | 39 |
| 41 | Massachusetts | 5 | 79,835 | 29 | 48 | 3 | 38 |
| 42 | Delaware | 5 | 64,805 | 25 | 50 | 3 | 38 |
| 43 | West Virginia | 4 | 44,097 | 25 | 50 | 3 | 39 |
| 44 | Florida | 4 | 55,462 | 27 | 48 | 3 | 38 |
| 45 | Georgia | 4 | 58,756 | 28 | 49 | 3 | 39 |
| 46 | Rhode Island | 6 | 64,340 | 24 | 44 | 3 | 38 |
| 47 | Alabama | 4 | 49,861 | 24 | 50 | 3 | 39 |
| 48 | Tennessee | 4 | 52,375 | 25 | 51 | 3 | 39 |
| 49 | Mississippi | 3 | 44,717 | 24 | 47 | 4 | 39 |
| 50 | Louisiana | 4 | 47,905 | 25 | 46 | 3 | 39 |
Author
Kathy is the head of content at Zippia with a knack for engaging audiences. Prior to joining Zippia, Kathy worked at Gateway Blend growing audiences across diverse brands. She graduated from Troy University with a degree in Social Science Education.