- Income Statistics
- Average PTO Days
- What Percentage of Americans Live Paycheck to Paycheck?
- Average American Income
- Millionaire Statistics
- Average Salary out of College
- Average Bonus Statistics
- Minimum Wage Statistics
- Union Benefits Statistics
- Savings Statistics
- Average Annual Raise
- Income Inequality Statistics
- How Many People Make Over 100k?
- Average 401(k) Sstatistics
- Average Net Worth Statistics
- $100k After-Tax Income By State
- Average Global Income
Research Summary: Many individuals look forward to enjoying a comfortable retirement, and a 401(k) plan plays a critical role in making that dream a reality. Without adequate retirement savings, achieving financial freedom in later years can be challenging for many Americans.
In this article, we present key insights into the state of 401(k) plans across the United States as of 2026. Based on our comprehensive research:
-
The median 401(k) balance for Americans stands at $20,100.
-
The average 401(k) balance is $97,200.
-
The average employer 401(k) match is 4.7%.
-
51% of employers with 401(k) plans offer matching contributions.
-
Only 10% of employers provide matches at the limit of 6% or more.
-
The average total annual fee for 401(k) plans is 2.22%.
-
The average per-capita administrative fee for 401(k) plans is $422.30.
For further analysis, we have categorized the data as follows:
Match | Fees | Balance | Demographics | Industry and Income | Participation | Facts | Retirement Plan Participation
401(k) Match Statistics
Employer matching contributions are highly valued by employees, but not all employers offer this benefit. Here are some insights into 401(k) matching practices:
Average 401(k) Match By Employers
| Match Percentage | Share of Employers |
|---|---|
| 0% | 49% |
| 0.1% – 6% | 41% |
| 6% or more | 10% |
-
The average employer-sponsored match for 401(k) plans is 4.7% of employee contributions.
-
49% of employers with 401(k) plans provide a match of 0%.
-
41% of employers who offer matching contributions do not exceed the 6% limit.
-
20% of employers require at least one year of service before matching 401(k) contributions.
-
70% of employers allow immediate participation in their 401(k) plans.
-
25%-33% of 401(k) funds are vested each year.
401(k) Fees Statistics
While 401(k) plans offer significant benefits, understanding the fee structure is essential. Here are some important facts regarding 401(k) fees in the United States:
-
The average annual fee for 401(k) plans is 1%.
This fee can vary significantly based on plan participation and provider, ranging from 0.5% to over 2%.
-
The average per-capita administrative fee is $422.30.
This fee is often covered through revenue sharing or variable annuity wraps, which can be perceived as hidden fees.
-
401(k) fees may increase by up to 3.5% annually.
For instance, even a consistent fee of 0.75% results in higher costs as your account balance grows; $350 on a $50,000 balance becomes $7,500 on a $1 million balance.
Average 401(k) Balance
Monitoring your 401(k) balance is crucial for retirement planning. Here are the latest trends regarding 401(k) balances in the U.S.:
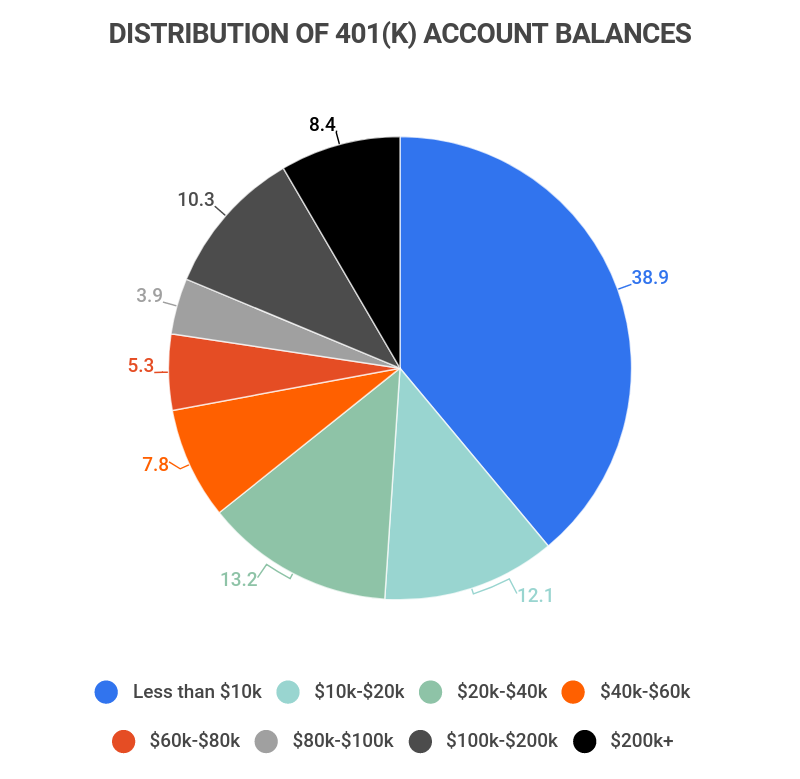
Distribution of 401(k) Account Balances
| Account Balance | Share of Account Holders |
|---|---|
| <$10k | 38.9% |
| $10k-$20k | 12.1% |
| $20k-$40k | 13.2% |
| $40k-$60k | 7.8% |
| $60k-$80k | 5.3% |
| $80k-$100k | 3.9% |
| $100k-$200k | 10.3% |
| $200k+ | 8.4% |
-
Nearly 39% of all 401(k) account holders have less than $10,000 in their accounts.
Moreover, over half of account holders (51%) possess less than $20,000, indicating that many Americans are falling short in retirement savings.
-
The median 401(k) balance is $20,100.
This figure is concerning, as experts recommend having a retirement account balance of at least 6 times your annual income at retirement. For instance, a person earning $60,000 annually would need a 401(k) balance of $600,000 for a secure retirement.
-
The average 401(k) balance is $97,200.
This average is significantly skewed by older and wealthier Americans, highlighting the disparities in retirement savings across demographics.
-
The average rate of return on a 401(k) plan is between 5% and 8% annually.
This return typically reflects a portfolio allocation of 60% in stocks and 40% in bonds, but can vary based on market conditions.
Average 401(k) Balance by Demographics
401(k) balances can vary based on several factors, including age, gender, and ethnicity. Here are some key insights into demographic disparities:
-
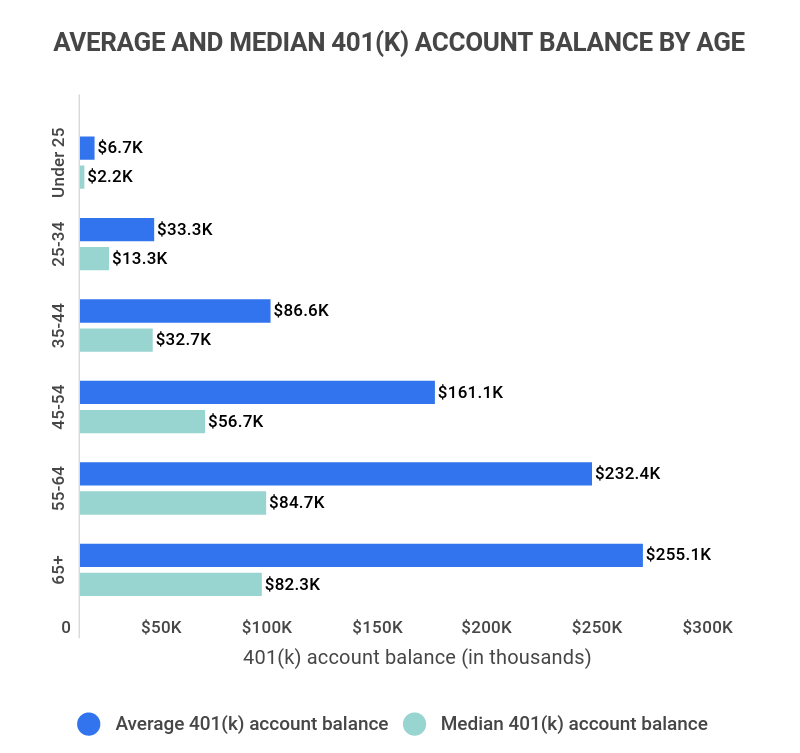
Americans aged 65+ have the highest average 401(k) account balance of $255,151.
The average balance increases with age as individuals contribute over their careers. For younger individuals, the average 401(k) balance for those under 25 is $6,718, with an even lower median balance.
Average and Median 401(k) Account Balance By Age
Age Range Average 401(k) Account Balance Median 401(k) Account Balance Under 25 $6,718 $2,240 25-34 $33,272 $13,265 35-44 $86,582 $32,664 45-54 $161,079 $56,722 55-64 $232,379 $84,714 65+ $255,151 $82,297 -
Only 7.7% of Gen Z have 401(k) accounts.
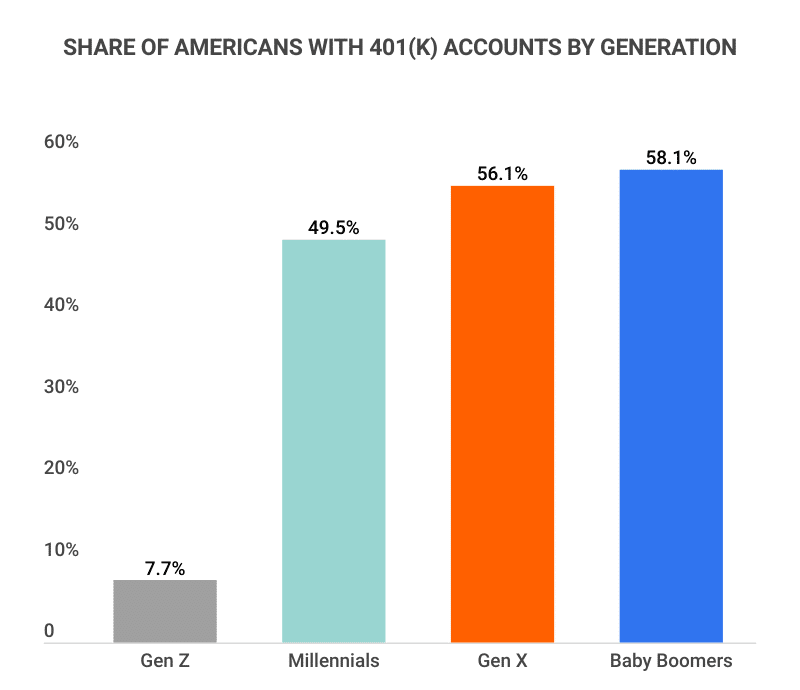
This low percentage highlights a generational gap, as 49.5% of Millennials have 401(k) accounts.
Share of Americans With 401(k) Accounts By Generation
Generation Share of Workers with 401(k) Plans Gen Z (ages 18-23) 7.7% Millennials (ages 24-39) 49.5% Gen X (ages 40-55) 56.1% Baby Boomers (ages 56-64) 58.1% -
57.7% of White Americans have a 401(k) plan compared to 31.9% of Hispanic Americans.
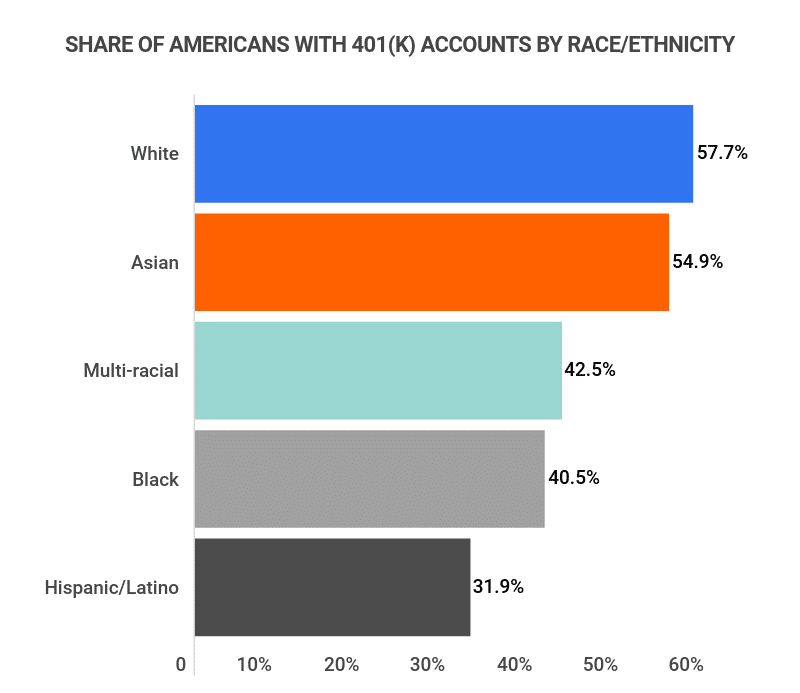
This disparity highlights ongoing inequalities, as Black Americans also have lower rates of 401(k) plan participation compared to their White or Asian counterparts.
Share Of Americans With 401(k) Plans By Race/Ethnicity
Race/Ethnicity Share of Workers with 401(k) Plans White 57.7% Asian 54.9% Multi-racial 42.5% Black 40.5% Hispanic/Latino 31.9% -
Men’s average 401(k) account balances exceed women’s by over 45%.
Men average $156,121 in their 401(k) accounts, while women average $107,147. The disparity is also evident in median balances, with women averaging $29,095 versus men at $42,516.
-
Women are less likely than men to have a 401(k) plan, with 43.5% participating compared to 47.8% of men.
This gap can be attributed in part to the higher likelihood of women working part-time, with 23% of women in part-time roles compared to just 12% of men.
Average 401(k) Balance by Industry and Income
Different industries offer varying levels of 401(k) benefits. Here are insights into average balances by sector:
-
The Agriculture, Mining, and Construction sectors have the highest average 401(k) balance at $176,369.
Conversely, the Wholesale and Retail sectors have the lowest average 401(k) balance, recorded at $87,390.
Average and Median 401(k) Account Balance By Industry
Industry Average 401(k) Account Balance Median 401(k) Account Balance Agriculture, Mining, Construction $176,369 $44,769 Finance, Insurance, Real Estate $154,841 $46,562 Business, Professional, Nonprofit $154,716 $38,777 Media, Entertainment, Leisure $151,110 $41,149 Manufacturing $141,066 $22,102 Transportation, Utilities, Communications $102,411 $61,488 Education and Health $97,401 $23,992 Wholesale and Retail $87,390 $15,658 -
Individuals earning $150,000 or more have the highest average 401(k) balance at $354,569.
Typically, higher earnings correlate with greater 401(k) balances, except for those earning between $15,000-$29,999, who have the lowest average balance at $15,766.
Average and Median 401(k) Account Balance By Income
Income Average 401(k) Account Balance Median 401(k) Account Balance Less than $15k $16,524 $2,557 $15k-$29.9k $15,766 $4,866 $30k-$49.9k $29,719 $10,317 $50k-$74.9k $69,438 $28,880 $75k-$99.9k $121,570 $58,572 $100k-$149.9k $193,944 $100,833 $150k+ $354,569 $195,076
401(k) Participation Statistics
Despite the advantages of 401(k) plans, many Americans either do not participate or lack access. Here are the latest trends in participation:
-
51% of employees participate in employer-sponsored 401(k) plans when available.
Of those with access, 68% opt to participate, while 17% choose not to.
-
84% of workers believe automatic 401(k) deductions from paychecks help them save effectively.
This perspective is grounded in the significant growth of 401(k) balances from age 25 to 65.
-
62% of employers implement automatic enrollment in their 401(k) plans.
This means employees are automatically enrolled unless they opt out, and employers define the percentage of wages deducted from each paycheck.
General 401(k) Facts
The dynamics of 401(k) plans reveal various insights based on age, income, and other factors. Here are additional facts illustrating the current state of 401(k) plans:
-
As of 2026, there are $6.3 trillion in assets held in 401(k) plans.
-
More than 625,000 401(k) plans operate in the U.S.
-
Over 60 million active 401(k) participants exist in the U.S.
-
54% of U.S. adults have either a 401(k) or a 403(b) plan.
-
18% of Americans own IRA or Keogh accounts.
-
19% of 401(k) assets are invested in index funds.
Retirement Plan Participation by Segment
Demographic trends reveal interesting patterns in retirement plan participation. Here are some key observations:
-
69% of private industry workers have access to retirement plans.
This is significantly lower than the 92% of public workers with access.
-
77% of full-time workers have access to retirement plans.
In comparison, only 39% of part-time workers have access, highlighting disparities in benefits.
-
91% of union members have access to retirement plans.
Unions play a significant role in ensuring employees have access to retirement benefits compared to 65% of non-union workers.
-
76% of goods-producing industry workers have access to retirement plans.
Conversely, only 65% of service-providing industry workers have access, reflecting industry disparities.
-
83% of employees at companies with 100+ employees have retirement plan access.
In contrast, only 53% of employees at companies with fewer than 100 employees have access.
-
88% of the top 25% of earners have access to retirement plans.
Access to retirement plans decreases as income levels drop; only 42% of those in the bottom 25% have access.
401(k) Match FAQ
-
What is a good 401(k) match?
A good 401(k) match is typically between 5-6%. This range represents a common upper limit for employer matches, with 41% of employers matching between just over 0% to 6%. However, 10% of employers exceed a 6% match.
Any employer match is beneficial, as 49% of employers do not offer any matching contributions.
-
What is the average 401(k) match?
The average 401(k) match is 4.7%. Most commonly, employers match 50% of employee contributions; for instance, if you contribute 6%, the employer contributes 3%.
-
What are the average 401(k) fees?
The average total fee for 401(k) plans is 2.22%. The average annual fee is about 1%, and the average per-capita administrative fee is $422.30.
It is important to recognize the variability in 401(k) fees, which can range from 0.5% to over 2% annually.
-
What are the hidden fees associated with a 401(k)?
While all fees must be disclosed, some fees may be unexpected. Revenue sharing, for example, can inflate investment expense ratios, which ultimately reduces investor returns.
Though revenue sharing fees can be minor, averaging $2.31 within a total of nearly $45, they accumulate over time.
-
What is the average 401(k) balance?
The average 401(k) balance is $97,200. However, this average can be misleading due to the influence of higher balances held by wealthier individuals. The median 401(k) balance is only $20,100, which may better reflect the savings of younger and less affluent Americans.
Conclusion
As of 2026, the average 401(k) account balance is $97,200, with a median balance of $20,100. These figures reflect diverse demographics and underscore a troubling trend.
Alarmingly, 36% of Americans still lack access to any retirement account, with many unable to save adequately. Women, ethnic minorities, part-time workers, and low-income individuals are particularly impacted by these disparities.
In this context, providing access to 401(k) plans and other retirement benefits is crucial for employers seeking to attract and retain talent in a competitive job market.
References
-
Fox Business – Average 401(k) Balances Drop Below $100,000: Fidelity
-
Employee Fiduciary – How to Find & Calculate Nationwide 401(k) Fees
-
Investopedia – What Is a Good 401(k) Match? How It Works and What’s the Average
-
The Motley Fool – What Rate of Return to Expect From Your 401(k)
-
T. Rowe Price Insights – Race, Retirement, and the Savings Gap
-
United States Census Bureau – New Data Reveal Inequality in Retirement Account Ownership
-
U.S. Department of Labor – Automatic Enrollment 401(k) Plans for Small Businesses
-
ICI – 401(k) Resource Center
-
U.S. Bureau of Labor – How Do Retirement Plans for Private Industry and State and Local Government Workers Compare?
-
U.S. Bureau of Labor – 67% of Private Industry Workers Had Access to Retirement Plans in 2020
- Income Statistics
- Average PTO Days
- What Percentage of Americans Live Paycheck to Paycheck?
- Average American Income
- Millionaire Statistics
- Average Salary out of College
- Average Bonus Statistics
- Minimum Wage Statistics
- Union Benefits Statistics
- Savings Statistics
- Average Annual Raise
- Income Inequality Statistics
- How Many People Make Over 100k?
- Average 401(k) Sstatistics
- Average Net Worth Statistics
- $100k After-Tax Income By State
- Average Global Income
Author
Jack Flynn is a writer for Zippia. In his professional career he’s written over 100 research papers, articles and blog posts. Some of his most popular published works include his writing about economic terms and research into job classifications. Jack received his BS from Hampshire College.