- Industry Statistics
- Wedding Industry Statistics
- Yoga Industry Statistics
- Music Industry Statistics
- Landscaping Industry Statistics
- Bicycle Industry Statistics
- Coffee Industry Statistics
- Car Rental Industry Statistics
- Home Improvement Industry Statistics
- Insurance Industry Statistics
- Supplements Industry Statistics
- Golf Industry Statistics
- Fitness Industry Statistics
- US Media And Entertainment Industry Statistics
- Firearm Industry Statistics
- Financial Services Industry Statistics
- Health And Wellness Industry Statistics
- Trucking Industry Statistics
- Wine Industry Statistics
- Pet Industry Statistics
- Mobile App Industry Statistics
- Digital Marketing Industry Statistics
- Hotel Industry Statistics
- Retail Statistics
- Robotics Industry Statistics
- Jewelry Industry Statistics
- Appointment Scheduling statistics
- Restaurant Industry Statistics
- Food Delivery Statistics
- Food Truck Industry
- Fashion Industry
- Real Estate Industry
- US Film Industry
- US Beverage Industry
- USu202fFast Food Restaurants
- US Construction Industry
- US Book Industry
- Cosmetics Industry
- US Food Retail Industry
- US Pharmaceutical Industry
- US Healthcare Industry
- Airline Industry
- Automobile Industry
- Transportation Industry Statistics
- Event Industry Statistics
- Project Management Statistics
- Oil And Gas Industry Statistics
- Nursing Home Statistics
- Nursing Shortage Statistics
- Nursing Statistics
20 Essential Car Rental Industry Statistics [2026]: Understanding the Car Rental Sector
Research Summary. The car rental industry has continually evolved since the disruptions caused by the pandemic, demonstrating resilience and adaptation in its recovery. Here are key statistics reflecting the current landscape.
-
The U.S. car rental market is projected to reach $31.43 billion in revenue by the end of 2026.
-
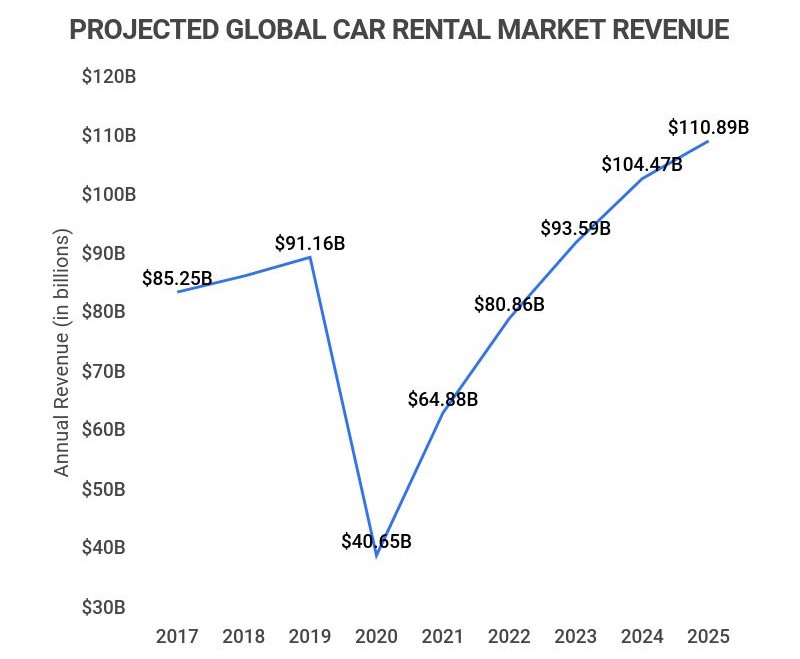
The global rental car market generates approximately $40.65 billion in revenue annually.
-
The global car rental industry is anticipated to experience a CAGR of 6.7% from 2020 to 2027.
-
The global car rental market size is expected to reach $144.21 billion by 2027.
-
The car rental industry is projected to serve 602.2 million users by 2026.
-
The average revenue per user (ARPU) in the car rental sector is $194.90.
For further analysis, we categorized the data into the following areas:
Companies | Prices | Consumers
U.S. Car Rental Industry Trends and Projections
-
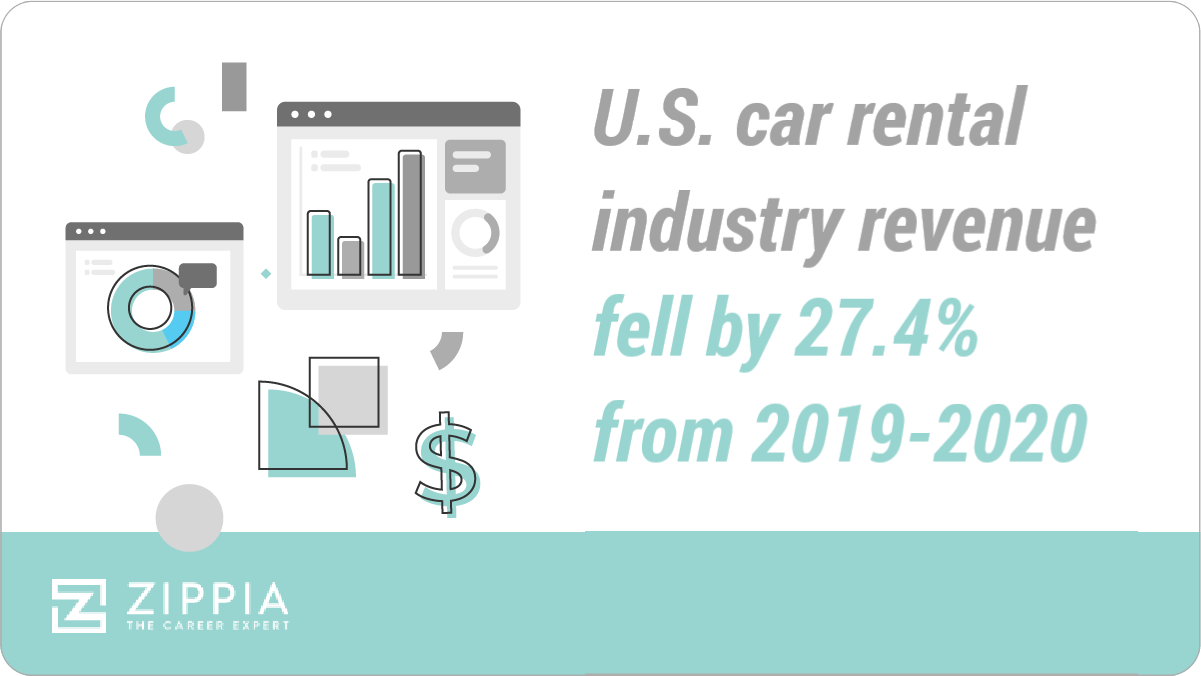
Revenue for the U.S. car rental industry saw a significant decline of 27.4% from 2019 to 2020.
In 2019, the industry reached a peak of $32 billion, which fell to $23.22 billion in 2020, marking the lowest revenue since 2011.
-
The U.S. car rental industry’s revenue rebounded with a 21% increase from 2020 to 2021.
As restrictions eased, revenue rose from $23.22 billion in 2020 to $28.1 billion in 2021, signaling a positive trajectory toward recovery.
-
Revenue growth for the U.S. car rental industry is projected to have a CAGR of 5.27% from 2022 to 2026.
This will result in an expected revenue of $31.43 billion by 2026.
-
The global car rental industry is poised for growth, projected to reach $144.21 billion by 2027.
With a CAGR of 6.7% expected from 2020 to 2027, this growth reflects the industry’s recovery and adaptation post-pandemic.
Car Rental Industry Statistics by Car Rental Companies
-
Enterprise Holdings remains the largest car rental company in the U.S., operating 6,000 locations.
The company manages 1.1 million vehicles across its brands, which include Enterprise, Alamo, and National Car Rental.
-
As of 2021, there were approximately 1.8 million rental cars in service in the U.S.
Although this figure is lower than pre-pandemic levels, the revenue per unit was a record $1,320 per month.
-
The majority of rental car companies in the U.S. are part of three major conglomerates: Enterprise Holdings, the Hertz Group, and the Avis-Budget Group.
These companies collectively control nearly 94% of the market share.
| Car Rental Company | Cars in Service | Number of Locations |
|---|---|---|
| Enterprise Holdings | 1.1M | 6K |
| Hertz | 430K | 3.8K |
| Avis Budget Group | 350K | 3.2K |
| Sixt | 18.5K | 100 |
| Fox Rent A Car | 18.2K | 21 |
| Ace Rent A Car | 9K | 60 |
| NP Auto Group | 7.5K | 100 |
| U-Save Auto Rental System | 5.5K | 124 |
| Rent-A-Wreck of America | 1.75K | 71 |
Car Rental Industry Statistics by Car Rental Prices
-
The average daily rental car price increased by $35 from 2019 to 2021.
As of December 2021, the average daily rental price was $81, up from $46 in December 2019.
-
Average rental prices have surged from $123.18 in December 2017 to $193.75 in December 2021.
Here’s a breakdown of the average cost from 2017 to 2022:
Year Cost 2022 $184.22 2021 $193.75 2020 $142.45 2019 $135.33 2018 $130.69 2017 $123.18 This data does not reflect the peak rental price of $236.80 in July 2021, the highest average price during this five-year period.
-
Car rental companies added 58% fewer vehicles to their fleets in 2021 compared to 2019.
This shortage, exacerbated by mass vehicle sales during the pandemic, has significantly contributed to rising rental prices.
Car Rental Industry Statistics by Car Rental Consumers
-
In 2019, approximately 44.5 million cars were rented in the U.S.
In 2020, this number dropped to about 17.3 million, but rentals rebounded to 29.2 million in 2021, with an estimated 46.8 million expected by 2024.
-
Customer satisfaction in car rentals decreased by 11 points on a 1,000-point scale from August 2020 to August 2021.
This decline was mainly attributed to higher prices and understaffing at rental locations, leading to longer wait times. Satisfaction scores fell from 841 to 830.
-
Enterprise holds the highest customer satisfaction rate at 861.
National and Alamo follow closely with scores of 852 and 837, respectively.
-
The average rental duration from Enterprise was 18.4 days as of 2022.
This figure includes rentals for auto repair purposes, so it reflects a mix of leisure and business use.
| Region | Average Billed Days (2022) |
|---|---|
| Mountain | 19.5 |
| Northeast | 18.4 |
| Southwest | 20.3 |
| California | 17.2 |
| Southeast | 20.0 |
| Mid-Atlantic | 18.1 |
| Pacific | 15.2 |
| Northwest | 19.9 |
| Midwest | 17.8 |
Car Rental Industry Statistics FAQ
-
What is the car rental industry?
The car rental industry is a for-profit sector focused on short-term vehicle rentals and longer-duration leasing services. It plays a crucial role in global mobility, catering to travelers across various countries.
-
How much is the car rental industry worth?
The global car rental industry was valued at $58.34 billion in 2020. The industry is projected to grow at a CAGR of 6.7% from 2020 to 2027, potentially reaching $144.21 billion by 2027. The U.S. car rental market generated $28.1 billion in revenue in 2021, recovering from a significant drop in 2020.
-
Is the car rental industry profitable?
Yes, the car rental industry can be profitable. Despite high overhead costs, the demand for rental cars generally supports a viable business model, as long as demand is maintained.
-
How concentrated is the car rental industry?
The car rental industry is moderately concentrated. In the U.S., three companies dominate nearly 94% of the market, while European markets feature additional competitors.
-
Who is the biggest car rental company?
Enterprise Holdings is the largest car rental company. It operates multiple brands and has a fleet of 1.1 million vehicles across 6,000 locations in the U.S.
-
Is the car rental industry growing?
Yes, the car rental industry is experiencing growth. The U.S. market is expected to see a CAGR of 5.27% from 2022 to 2026, with global growth projected at a CAGR of 6.7% during the same period.
Conclusion
The car rental industry has made significant strides in recovering from the pandemic’s impacts, with companies adapting to new market realities. Despite initial challenges, the U.S. car rental revenue is set to rise, projected to grow at a CAGR of 5.27% through 2026. The global car rental market is also on an upward trajectory, with expectations of reaching a value of $144.21 billion by 2027.
References
-
Auto Rental News. “2021 U.S. Car Rental Revenue Climbs 21% Year-Over-Year.” Accessed on April 6, 2022.
-
Statista. “Revenue in the Car Rentals Market Worldwide From 2017 to 2025.” Accessed on April 6, 2022.
-
Auto Rental News. “U.S. Car Rental Revenue Dives 27.4% in 2020.” Accessed on April 6, 2022.
-
Statista. “Car Rentals: United States.” Accessed on April 6, 2022.
-
Fortune Business Insights. “Car Rental Market Size, Share, and COVID-19 Impact Analysis, By Vehicle Type (Luxury Cars, Executive Cars, Economy Cars, SUVs, and MUVs), By Application Type (Local Usage, Airport Transport, Outstation, and Others), By Rental Duration Type (Short-Term, Long-Term), and Regional Forecast, 2020-2027.” Accessed on April 6, 2022.
-
Zippia. “10 Largest Car Rental Companies in the United States.” Accessed on April 6, 2022.
-
Statista. “U.S. Market Share of Car Rental Companies in 2017.” Accessed on April 6, 2022.
-
Y Charts. “U.S. Consumer Price Index: Car and Truck Rental.” Accessed on April 6, 2022.
-
Car and Driver. “Car Rental Average Daily Price Up $35 Just Since December 2019.” Accessed on April 6, 2022.
-
News and Record. “How COVID-19 Affected Car Rentals Over the Past Year.” Accessed on April 6, 2022.
-
Business Wire. “Rental Car Customer Satisfaction Drops as Vehicle Shortage Causes Prices to Surge, J.D. Power Finds.” Accessed on April 6, 2022.
-
Enterprise. “U.S. Average Length of Rental by Region Q1 – 2020.” Accessed on April 6, 2022.
-
Global Fleet. “How COVID-19 Impacts Rental Car Industry.” Accessed on April 6, 2022.
-
Y Charts. “U.S. Consumer Price Index: Car and Truck Rental.” Accessed on March 10, 2023.
-
Enterprise. “U.S. Length of Rental By State Q4 2022.” Accessed on March 10, 2023.
- Industry Statistics
- Wedding Industry Statistics
- Yoga Industry Statistics
- Music Industry Statistics
- Landscaping Industry Statistics
- Bicycle Industry Statistics
- Coffee Industry Statistics
- Car Rental Industry Statistics
- Home Improvement Industry Statistics
- Insurance Industry Statistics
- Supplements Industry Statistics
- Golf Industry Statistics
- Fitness Industry Statistics
- US Media And Entertainment Industry Statistics
- Firearm Industry Statistics
- Financial Services Industry Statistics
- Health And Wellness Industry Statistics
- Trucking Industry Statistics
- Wine Industry Statistics
- Pet Industry Statistics
- Mobile App Industry Statistics
- Digital Marketing Industry Statistics
- Hotel Industry Statistics
- Retail Statistics
- Robotics Industry Statistics
- Jewelry Industry Statistics
- Appointment Scheduling statistics
- Restaurant Industry Statistics
- Food Delivery Statistics
- Food Truck Industry
- Fashion Industry
- Real Estate Industry
- US Film Industry
- US Beverage Industry
- USu202fFast Food Restaurants
- US Construction Industry
- US Book Industry
- Cosmetics Industry
- US Food Retail Industry
- US Pharmaceutical Industry
- US Healthcare Industry
- Airline Industry
- Automobile Industry
- Transportation Industry Statistics
- Event Industry Statistics
- Project Management Statistics
- Oil And Gas Industry Statistics
- Nursing Home Statistics
- Nursing Shortage Statistics
- Nursing Statistics
Author
Abby is a writer who is passionate about the power of story. Whether it’s communicating complicated topics in a clear way or helping readers connect with another person or place from the comfort of their couch. Abby attended Oral Roberts University in Tulsa, Oklahoma, where she earned a degree in writing with concentrations in journalism and business.