Find a Job You Really Want In
The FBI recently released its 2026 crime rate statistics, revealing a mixed bag of trends. While nationwide property crime has seen a decrease compared to previous years, the violent crime rate has experienced an uptick for the third consecutive year. Simultaneously, reports from Inequality.org indicate that the wealth gap in the United States has continued to widen, presenting a concerning trend “by every statistical measure.”
Income inequality has been extensively studied in relation to rising violent crime rates, yet many of these studies focus on international or regional scales and neglect property crime statistics. Our analysis for 2026 aligns with historical trends while examining these critical dynamics.

Some cities defy the expected correlations, showcasing both positive and negative outlier trends.
Positive Outliers:
- Rochester Hills, MI
- Newton, MA
- O’Fallon, MO
Negative Outliers:
Methodology
We conducted a regression analysis on crime rates and income inequality metrics across major American cities. Our dataset includes the latest FBI crime statistics for the 464 most populous cities in the United States, ensuring a comprehensive city-level analysis.
Unlike many prior studies, we incorporated property crime rates alongside violent crime statistics into our analysis.
For our inequality metric, we utilized the Gini coefficient, a statistical measurement that gauges income disparities within populations. A Gini score of 0 indicates perfect equality, while a score of 1 represents total inequality.
In our study, the Gini scores for the 464 cities ranged from a low of 0.34 to a high of 0.63.
Findings and Correlations
Income inequality is not just a national concern; it significantly impacts American cities as well. Our analysis reveals a strong correlation between income inequality and crime rates, encompassing both property and violent crimes.
While factors such as unemployment and poverty show weak correlations with crime rates, alcohol abuse has no significant connection to violent crime. These findings are consistent with various international studies conducted by reputable organizations.
All cities should be vigilant regarding the growing income inequality, as evidenced by our outliers and research indicating that:
Income inequality alone accounted for 74% of the variance in murder rates, and 50% of aggravated assaults. However, social capital demonstrated an even stronger association, explaining 82% of homicides and 61% of assaults.
A lack of social capital—defined as the value individuals place on community ties—serves as a profound predictor of violent crime. This phenomenon may be cyclical, as “strain theory” suggests that individuals facing economic hardship may internalize reduced social norms and view crime as more acceptable.
As you explore the factors contributing to the unique situations in both high and low-crime outlier cities, consider these dynamics carefully.
Cities with Unexpected Crime Rates
Some cities exhibit crime rates significantly higher than predicted by our statistical models, while others are surprisingly low despite expected income disparities.
As you review these examples, we advise caution in making broad comparisons between cities. The FBI emphasizes the importance of understanding the unique conditions influencing each jurisdiction, stating:
Valid assessments require careful study and analysis of the unique conditions affecting each local law enforcement jurisdiction. Data users are cautioned against comparing crime data of individual reporting units based solely on population size.
Salt Lake City, Utah — Negative Outlier
Gini Coefficient: 0.52
Crimes Per Household: 0.24
Median Income: $47,243
Salt Lake City stands out as the most significant outlier in our dataset, with a crime rate nearly double what income inequality would predict. Despite a 2025 poll indicating that many residents perceive crime as manageable, they may be unaware that the city has the highest property crime per household in the nation.
This perception is likely influenced by geographic disparities, with safer respondents typically residing in the eastern neighborhoods. The west side grapples with higher rates of homelessness and substance abuse, contributing to the crime statistics for the 10% of residents earning less than $10,000 annually.
West Jordan also reports a crime rate exceeding predictions, despite a median income approaching $70,000, with over 45% of residents earning above $75,000.
Springfield, Missouri — Negative Outlier

Gini Coefficient: 0.47
Crimes Per Household: 0.23
Median Income: $33,557
Springfield has frequently been labeled one of the “most dangerous cities” due to its violent crime rates. However, we are analyzing overall crime rates per household, which remain alarmingly high. The city’s crime rate exceeds predictions by more than double.
It’s important to note that approximately one-third of reported violent crimes in 2025 were domestic violence incidents. Springfield also recorded 14,251 property crimes, placing it among the top cities for property crime per household.
In comparison, nearby St. Louis, despite a population nearly double Springfield’s, has only about 25% more crime instances and a 25% lower likelihood of victimization.
Miami Beach, Florida — Negative Outlier
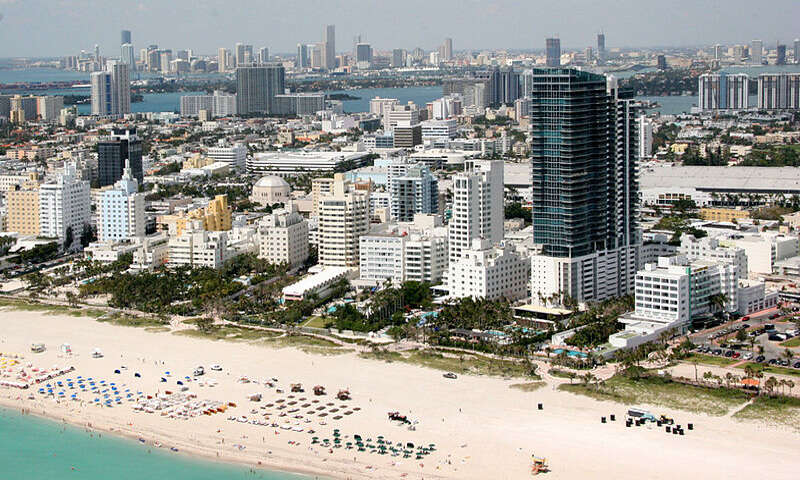
Gini Coefficient: 0.63
Crimes Per Household: 0.22
Median Income: $44,342
Miami Beach experiences a high incidence of property crime per household, with 8,419 incidents reported among 43,266 residents. In contrast, the City of Miami, with a population four times larger, exhibits significantly fewer property crimes, though it has a markedly higher murder rate.
Many of these property crimes are petty thefts linked to tourism, which skews the statistics since they are not directly reflected in household counts. The upcoming November vote to adjust last-call times could potentially influence future crime rates, and we will keep you updated.
Newton, Massachusetts — Positive Outlier
Gini Coefficient: 0.50
Crimes Per Household: 0.02
Median Income: $122,080
Newton, often identified with the Greater Boston area, boasts one of the lowest crime rates per household in the nation, significantly lower than demographic predictions. This affluent community, with a median income well above the national average, reported no murders and only 46 violent crimes in 2025. Its smaller-than-average police force contributes to these low crime figures.
Newton’s wealth distribution is marked by high property values, with nearly 60% of households earning more than $100,000 annually. Income inequality here may stem from a significant portion of households earning over $200,000, highlighting a complex economic landscape.
O’Fallon, Missouri — Positive Outlier

Gini Coefficient: 0.37
Crimes Per Household: 0.04
Median Income: $78,266
O’Fallon, a suburb of St. Louis, also defies the expected crime trends, exhibiting a crime rate significantly lower than predicted. This city has seen a general decline in crime rates across the board and is noteworthy for its relatively balanced income distribution.
Despite a median income close to $80,000, only 16% of households earn below $35,000. The local police department engages the community through programs like the Citizens Police Academy, fostering positive relationships between residents and law enforcement.
Rochester Hills, Michigan — Positive Outlier

Gini Coefficient: 0.44
Crimes Per Household: 0.02
Median Income: $82,122
Rochester Hills, a suburb of Detroit, reports the lowest crime rate per household in the country, making it a top choice for families seeking safety. The city is also recognized for its minimal police costs among the communities assessed in this analysis.
For those looking to relocate to the Detroit area while minimizing crime risk, Rochester Hills represents a prime choice, albeit with a higher cost of living.
A Cautious Conclusion
Research consistently shows that economic disparity contributes to educational gaps, strains government resources, and undermines political engagement among the middle class globally.
The detachment individuals feel from society also plays a critical role in these dynamics. It’s noteworthy that the low-crime outliers we discussed are suburbs of larger metropolitan areas facing significant crime challenges. Conversely, the high-crime outliers are often dealing with economic downturns or homelessness—forms of widespread social detachment.
Author
David Luther was the Content Marketing Editor for the Zippia Advice blog. He developed partnerships with external reporting agencies in addition to generating original research and reporting for the Zippia Career Advice blog. David obtained his BA from UNC Chapel Hill.