- Industry Statistics
- Wedding Industry Statistics
- Yoga Industry Statistics
- Music Industry Statistics
- Landscaping Industry Statistics
- Bicycle Industry Statistics
- Coffee Industry Statistics
- Car Rental Industry Statistics
- Home Improvement Industry Statistics
- Insurance Industry Statistics
- Supplements Industry Statistics
- Golf Industry Statistics
- Fitness Industry Statistics
- US Media And Entertainment Industry Statistics
- Firearm Industry Statistics
- Financial Services Industry Statistics
- Health And Wellness Industry Statistics
- Trucking Industry Statistics
- Wine Industry Statistics
- Pet Industry Statistics
- Mobile App Industry Statistics
- Digital Marketing Industry Statistics
- Hotel Industry Statistics
- Retail Statistics
- Robotics Industry Statistics
- Jewelry Industry Statistics
- Appointment Scheduling statistics
- Restaurant Industry Statistics
- Food Delivery Statistics
- Food Truck Industry
- Fashion Industry
- Real Estate Industry
- US Film Industry
- US Beverage Industry
- USu202fFast Food Restaurants
- US Construction Industry
- US Book Industry
- Cosmetics Industry
- US Food Retail Industry
- US Pharmaceutical Industry
- US Healthcare Industry
- Airline Industry
- Automobile Industry
- Transportation Industry Statistics
- Event Industry Statistics
- Project Management Statistics
- Oil And Gas Industry Statistics
- Nursing Home Statistics
- Nursing Shortage Statistics
- Nursing Statistics
18+ Food Delivery Statistics [2026]: Online Ordering Industry Numbers You Need To Know
Research Summary. The food delivery industry has undergone transformative changes in recent years, especially as consumer preferences evolved significantly post-pandemic. Today, more restaurants are embracing food delivery services, and platforms like DoorDash and Uber Eats continue to thrive. This article explores the current state of the food delivery industry in 2026. Based on our comprehensive research:
-
80% of Americans order delivery at least once per week.
-
Online food ordering has surged 300% faster than dine-in since 2014 and now constitutes approximately 40% of total restaurant sales.
-
Market revenue for the food delivery industry has increased by 204% over the last five years.
-
The average American spends $70 on takeout per week.
-
From 2021-2022, U.S. food delivery revenue increased by 20%, growing from $26.5 billion to $31.8 billion.
-
For further analysis, we broke down the data in the following ways:
Consumer Ordering Preferences | Delivery vs. Dine-in | Grocery Delivery | Trends + Projections

U.S. Food Delivery App Users 2015-2026
Year Number Of Users 2026 130 million 2025 120 million 2024 110 million 2023 102 million 2022 95 million 2021 85 million General Food Delivery Industry Statistics
The pandemic significantly impacted the food delivery industry, but the trend of online ordering continues to grow. Here are the latest insights:
-
As of 2022, the food delivery app industry generated $31.8 billion in revenue.
This represents a 20% increase from 2021, when revenue was approximately $26.5 billion. The industry maintains robust growth as consumer habits shift.
-
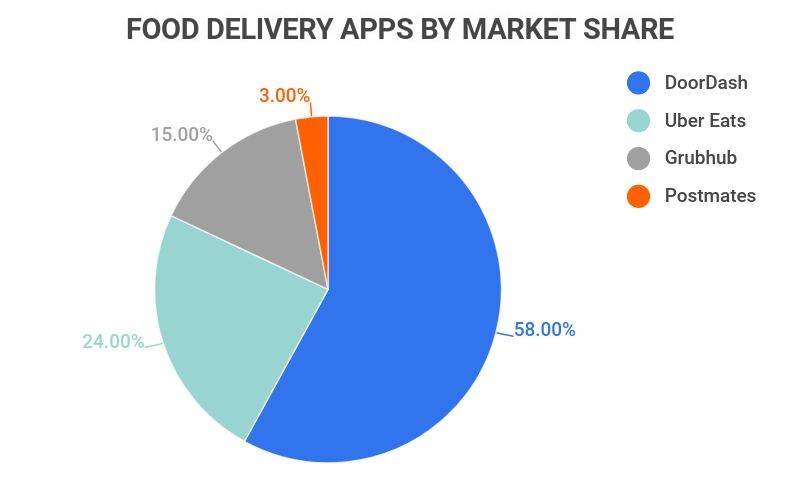
DoorDash commands the largest market share with 58% of users in the online food delivery sector.
Comparatively, Uber Eats holds 25% and GrubHub has 12%.
-
DoorDash also leads in sales, reaching a total revenue of $3.5 billion in 2021.
This is a substantial increase from 2020, when DoorDash’s revenue was $2.9 billion. In comparison, Uber Eats generated $2.9 billion and GrubHub $1.5 billion.
-
Online Food Delivery: Consumer Ordering Preferences
Consumer interest drives the growth of food delivery apps. Here are key insights on consumer behavior:
-
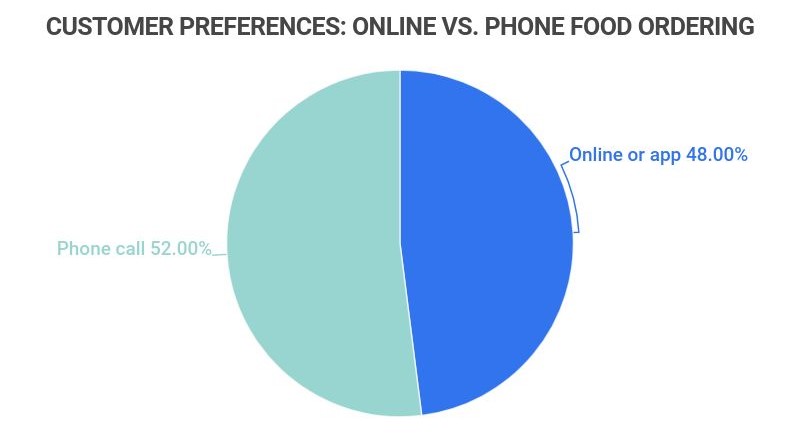
55% of customers still prefer calling the restaurant for food delivery orders.
Despite the prevalence of food delivery apps, a significant number of consumers still contact restaurants directly.
-
In 2021 alone, there were 130 million food delivery app users.
This steady growth reflects a year-on-year increase in users, highlighting the ongoing popularity of food delivery services.
-
70% of consumers hold both the restaurant and the delivery company accountable for poor service.
Notably, 75% of customers blame both parties when food arrives at the “wrong temperature.”
-
With nearly 12 billion visits, Friday remains the busiest day for food delivery services.
Following closely is Saturday with 11.8 billion visits, while other weekdays hover around 10 billion visits.
-
Online Food Delivery Statistics vs. Dine-In Restaurants
The comparison between app orders and dine-in experiences is crucial. Here are the latest insights:
-
64% of Americans still prefer dine-in experiences over delivery.
However, participation in both services is relatively even, with 55% dining in at least once per week and 52% ordering delivery at the same frequency.
-
About 80% of restaurants now offer delivery through third-party apps.
This trend is expected to continue, as third-party apps contribute significantly to sales.
-
The average American spends 20% more annually on food delivery compared to dine-in.
The average dine-in cost is around $3,500 per year ($67 per week), while food delivery costs roughly $4,200 annually ($80 per week).
-
Food Delivery Statistics by Grocery Delivery
Grocery delivery has also surged in popularity. Here are key trends:
-
From 2021-2022, grocery delivery grew from 10.2% to 15.5% of the total market.
This growth indicates an increase from $106 billion in 2020 to approximately $140 billion in 2022.
-
Instacart leads grocery delivery services with 15 million users as of 2021.
This represents a significant increase from 9.6 million users in 2020, showcasing a 56% growth.
-
Urban areas like New York, California, and Washington, D.C. order food delivery at rates up to 350% higher than the national average.
This highlights a greater reliance on food and grocery delivery services in metropolitan areas.
-
Food Delivery Statistics: Trends and Predictions
The demand for food delivery services continues to rise. Here are notable trends and predictions:
-
Spending on third-party food services in suburban areas increased by 15% in 2021.
This reflects the growing acceptance of food delivery in suburban communities.
-
The food delivery industry is expected to experience a CAGR of 12% between 2021 and 2026.
This estimate projects growth from $18.5 billion to $40 billion, illustrating that the industry’s expansion is not solely pandemic-driven but rooted in shifting consumer habits.
-
U.S. food delivery revenue increased by 70% from 2015-2021.
Revenue rose from $8.7 billion in 2015 to $31.8 billion in 2021, highlighting consistent year-over-year growth rather than a one-time spike.
-
As of 2022, the year-over-year growth of the U.S. food delivery market reached 20%.
Globally, this growth rate is even higher, with estimates reaching 30%.

U.S. Food Delivery App Revenue 2015-2026
| Year | Revenue |
|---|---|
| 2026 | $31.8 billion |
| 2025 | $28 billion |
| 2024 | $24 billion |
| 2023 | $20 billion |
| 2022 | $16.5 billion |
| 2021 | $13 billion |

Food Delivery Statistics FAQ
-
What percentage of people order food online?
At least 80% of Americans have ordered food online. However, food delivery still represents only 10.2% of the total market. Participation in dine-in versus delivery is nearly equal, with 55% dining in once a week and 52% ordering delivery.
-
What is the most popular food ordered for delivery?
Popularity varies by app. Here are top foods from DoorDash and Uber Eats:
-
DoorDash: Chicken fingers, French fries, fried chicken sandwich, Mac and Cheese, Chips, Apple pie, Chicken quesadillas, Iced coffee, and California roll.
-
Uber Eats: French fries, Pad Thai, Garlic naan, Soda, Miso soup, California roll, Chicken tikka masala, Edamame, Mozzarella sticks, and Spicy tuna roll.
Asian cuisine continues to dominate the delivery landscape, with Taiwanese food seeing significant increases in orders.
-
-
Is the food delivery market growing?
Yes, the food delivery market is experiencing growth. Online food ordering has grown 300% faster than dine-in since 2014, now accounting for about 40% of total restaurant sales. The industry is projected to maintain a CAGR of 12% through 2026.
-
How much has the pandemic increased food delivery?
The pandemic significantly accelerated the growth of food delivery, particularly through third-party apps. Major cities reported a 350% increase in food delivery usage since early pandemic days.
-
What percentage of food is delivered?
Currently, between 8-9% of food is delivered in the U.S. While the percentage of food service sales attributed to online ordering increased due to the pandemic, modest growth is expected from 2019-2022.
-
Who uses food delivery services the most?
Individuals aged 18 to 29 utilize food delivery services the most, with approximately two-thirds using these apps at least once a year, compared to around 50% of those aged 30 to 44.
-
No, food delivery is not currently profitable. While companies like DoorDash and Uber Eats generate billions in revenue, operational costs often exceed earnings. However, improvements in logistics and increasing demand may lead to future profitability.
Conclusion
The U.S. food delivery industry has consistently grown over the past decade, with the pandemic accelerating this trend. Online food ordering has expanded by 300% compared to dine-in since 2014, now representing about 40% of restaurant sales. Additionally, grocery delivery has also increased notably in market share.
Overall, the food delivery industry is anticipated to maintain a healthy CAGR of 12% from 2021 to 2026, indicating that as consumer behavior continues to evolve, the industry will thrive irrespective of external challenges.
Sources:
-
BusinessofApps. “Food Delivery App Revenue and Usage Statistics (2026).” Accessed on [insert date].
-
EMR. “United States Online Food Delivery Market Outlook.” Accessed on [insert date].
-
Mashable. “Survey reveals who’s winning the delivery app wars: DoorDash, Uber Eats, or Grubhub.” Accessed on [insert date].
-
BusinessofApps. “DoorDash Revenue and Usage Statistics (2026).” Accessed on [insert date].
-
RestaurantDive. “Study: 70% of diners blame both restaurants and delivery companies for bad service.” Accessed on [insert date].
-
MARS Food Services. “Catering to Consumer Behavior Throughout the Week.” Accessed on [insert date].
-
RestaurantDive. “64% of Americans prefer dine-in to takeout, delivery.” Accessed on [insert date].
-
QSR. “Restaurants and Third-Party Delivery Companies Come to Terms.” Accessed on [insert date].
-
Money Under 30. “The True Cost Of Eating Out (And How To Save).” Accessed on [insert date].
-
Supermarket News. “Online grocery to more than double market share by 2025.” Accessed on [insert date].
-
BusinessofApps. “Instacart Revenue and Usage Statistics (2026).” Accessed on [insert date].
-
Earnest. “How Much Do People Spend in Each Sector of the Food Economy?” Accessed on [insert date].
-
Fox Business. “Food delivery sales spike in suburbs.” Accessed on [insert date].
-
Bloomberg Second Measure. “Which company is winning the restaurant food delivery war?” Accessed on [insert date].
-
Bloomberg Second Measure. “Market share of online food delivery companies in the United States as of March 2026.” Accessed on [insert date].
- Industry Statistics
- Wedding Industry Statistics
- Yoga Industry Statistics
- Music Industry Statistics
- Landscaping Industry Statistics
- Bicycle Industry Statistics
- Coffee Industry Statistics
- Car Rental Industry Statistics
- Home Improvement Industry Statistics
- Insurance Industry Statistics
- Supplements Industry Statistics
- Golf Industry Statistics
- Fitness Industry Statistics
- US Media And Entertainment Industry Statistics
- Firearm Industry Statistics
- Financial Services Industry Statistics
- Health And Wellness Industry Statistics
- Trucking Industry Statistics
- Wine Industry Statistics
- Pet Industry Statistics
- Mobile App Industry Statistics
- Digital Marketing Industry Statistics
- Hotel Industry Statistics
- Retail Statistics
- Robotics Industry Statistics
- Jewelry Industry Statistics
- Appointment Scheduling statistics
- Restaurant Industry Statistics
- Food Delivery Statistics
- Food Truck Industry
- Fashion Industry
- Real Estate Industry
- US Film Industry
- US Beverage Industry
- USu202fFast Food Restaurants
- US Construction Industry
- US Book Industry
- Cosmetics Industry
- US Food Retail Industry
- US Pharmaceutical Industry
- US Healthcare Industry
- Airline Industry
- Automobile Industry
- Transportation Industry Statistics
- Event Industry Statistics
- Project Management Statistics
- Oil And Gas Industry Statistics
- Nursing Home Statistics
- Nursing Shortage Statistics
- Nursing Statistics
Author
Jack Flynn is a writer for Zippia. In his professional career he’s written over 100 research papers, articles and blog posts. Some of his most popular published works include his writing about economic terms and research into job classifications. Jack received his BS from Hampshire College.